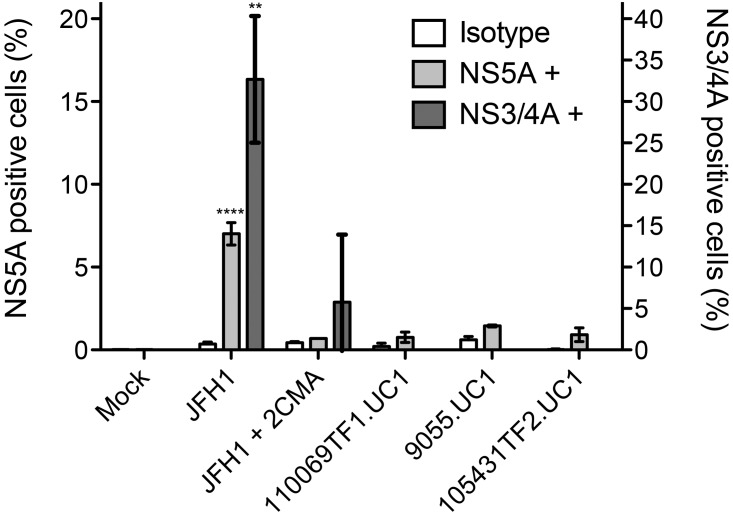
FIG 6 .
Comparative launch of T/F and JFH-1 vRNA in Huh 7.5 cells. Huh 7.5 cells were electroporated with in vitro-transcribed RNA from pJFH-1 and T/F molecular clones 110069TF1.UC1, 9055.UC1, and 105431TF2.UC1. NS5A expression, determined by flow cytometry, is represented in white and light gray bars. NS3/4A activity, determined by translocation of the MAVS-NLS-RFP signal, is presented in the dark gray bars. Error bars represent the standard deviation (**, P < 0.01; ****, P < 0.0001).

