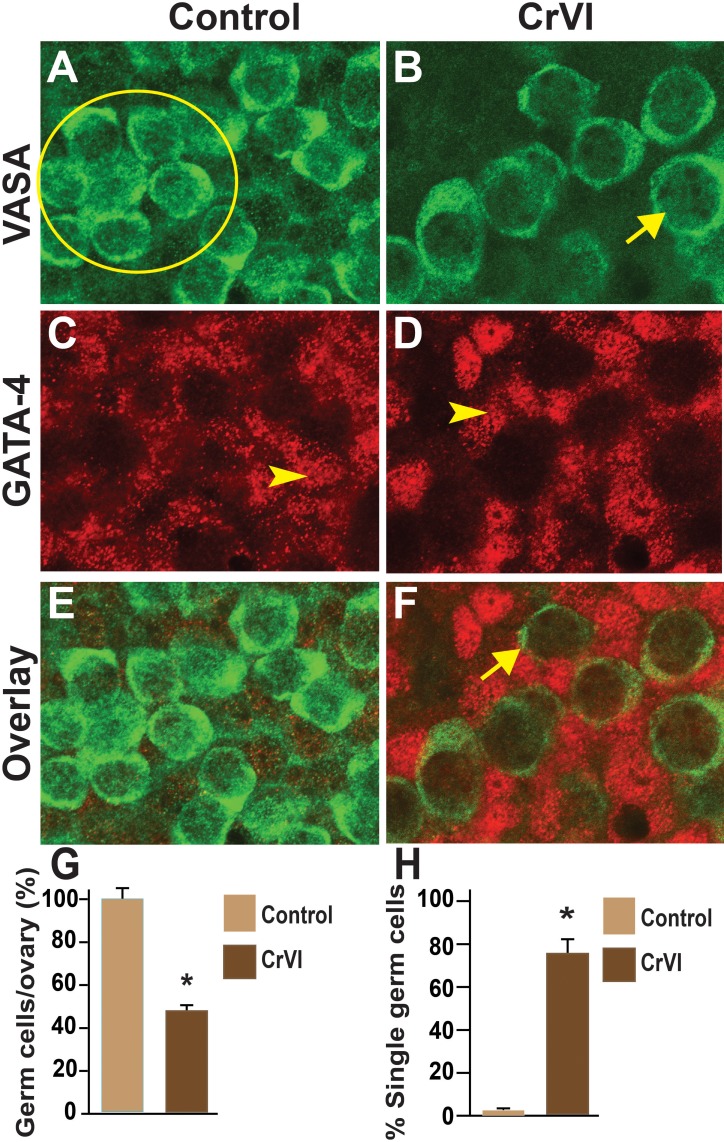
FIG. 4.
Effects of prenatal exposure to CrVI on GCN breakdown in the fetal ovary on ED 15.5. Ovaries from ED 15.5 were processed for whole-mount double immunofluorescence assay and imaged by confocal microscopy. Germ cells were identified by Vasa immunostaining (green; A and B) and somatic cells by Gata4 immunostaining (red; C and D), with overlays shown (E and F). The average number of germ cells or oocytes per ovary (G) and the percentage of single oocytes (H) are also shown. Arrows indicate germ cells; arrowheads indicate somatic cells. A circle or ellipse indicates a GCN. The width of field for each image is 115 μm. *P < 0.05, control vs. CrVI.

