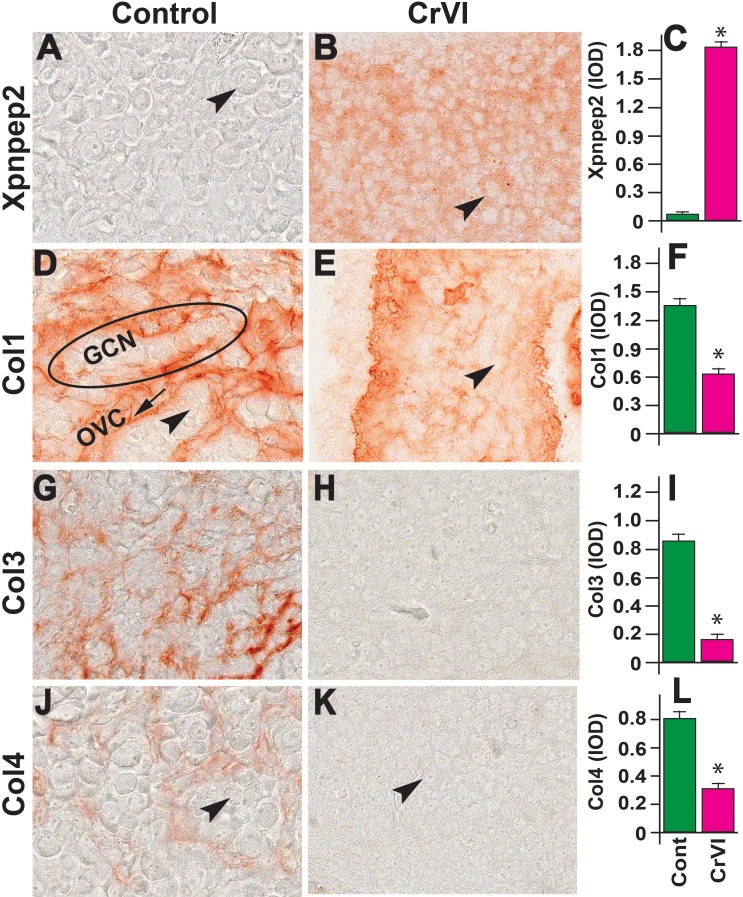
FIG. 6.
Effects of prenatal exposure to CrVI on the expression of Xpnpep2 (A–C), Col1 (D–F), Col3 (G–I), and Col4 (J–L) proteins in the ED 15.5 ovaries. Ovaries from ED 15.5 fetuses were processed for IHC, and the integrated optical density (IOD) of staining was quantified using Image ProPlus software. The width of field for each image is 220 or 350 μm. Arrowheads indicate germ cells. An ellipse indicates a GCN; an arrow indicates ovigerous cord (OVC). Each value represents the mean ± SEM of 20–24 ovaries. *P < 0.05, control vs. CrVI.

