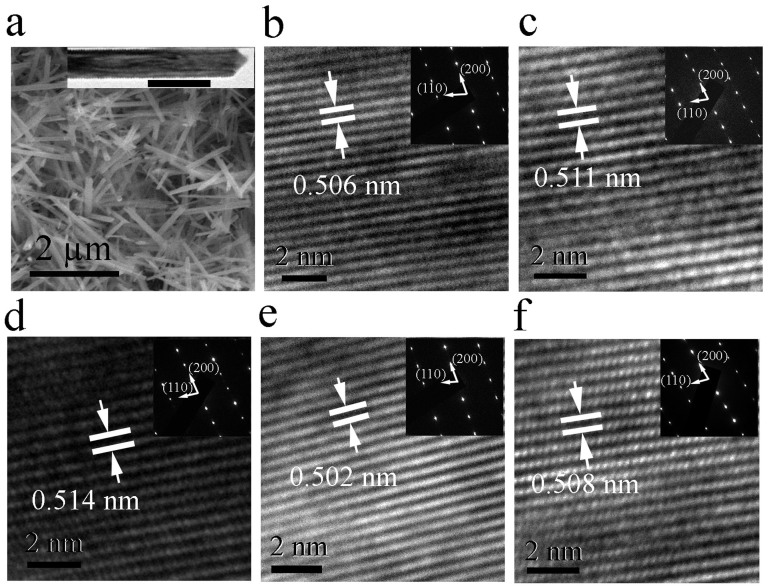
Figure 1. SEM and TEM images of alkaline element doped MnO2.
(a) SEM image of α-MnO2 nanotubes. The inset is the TEM image of a single MnO2 nanotube at low magnification. The data bar is 100 nm. (b) – (f) are high resolution TEM images in the (200) plane of the 2 at%, 6 at%, 12 at% K-doped MnO2, 6 at% Li and 6 at% Na doped MnO2 respectively. The insets are SAED patterns of the corresponding samples.

