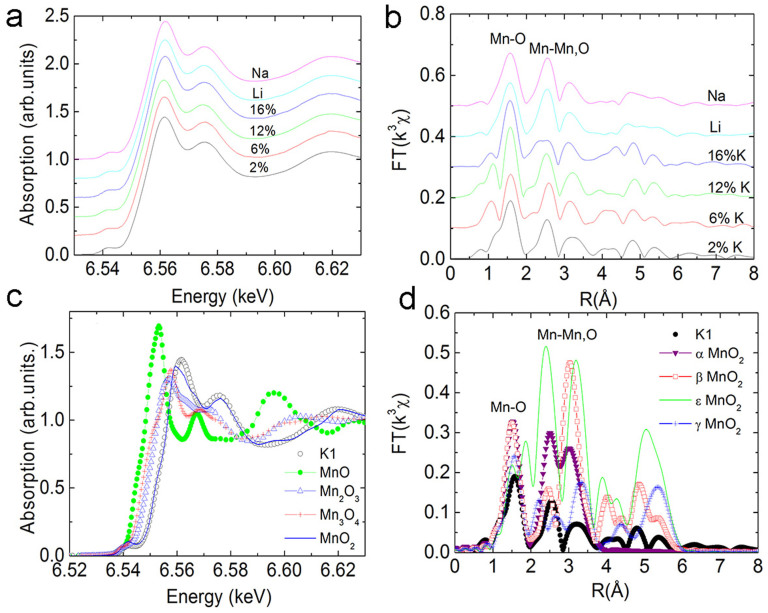
Figure 2. XAFS of alkaline element doped MnO2.
(a) XAFS spectra of K-MnO2 at different doping concentrations and Li/Na doped MnO2; (b) Fourier transform of the XAFS data in (a); (c)XAFS in the near edge of different forms of manganese oxides; (d) Fourier transformation of 2 at% K-doped MnO2 and MnO2 at different phases.

