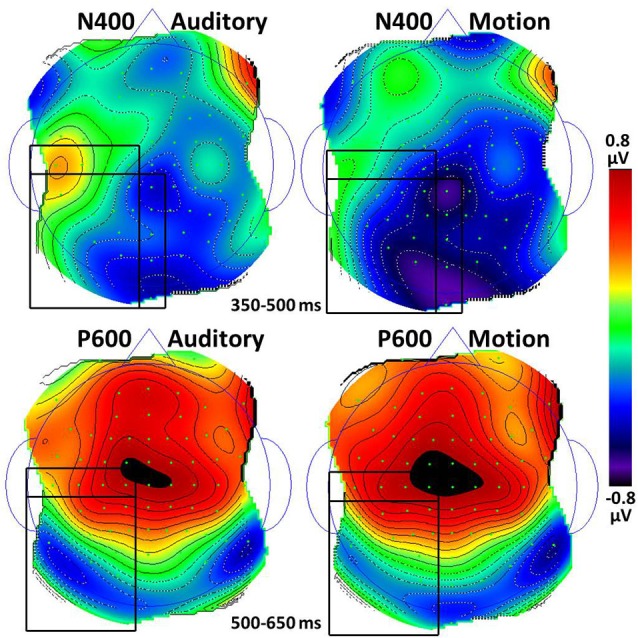
Figure 3.

Topographic maps of the N400 and P600 responses to the last word in auditory and motion sentences (anomalous excluded). For the N400, black rectangles indicate the Left Center, Left Posterior, and Center Posterior regions which had statistical differences between auditory and motion conditions, ps < 0.05. For the P600, black rectangles indicate the Left Center and Left Posterior regions which had differences approaching significance (ps < 0.18); the location × condition interaction was significant.
