
Figure 2.
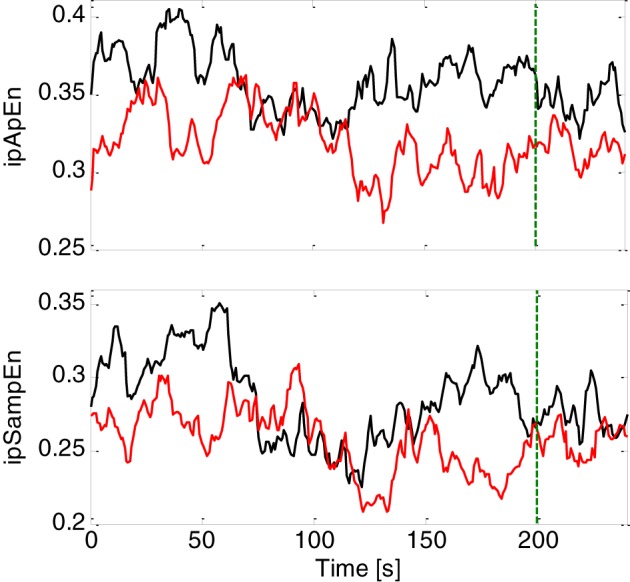
Instantaneous complex heartbeat dynamics expressed as ipApEn (top panel) and ipSampEn (bottom panel) during the emotional elicitation task. Values are averaged among healthy subjects (continuous black line) and patients with MD (continuous red line). The green dotter vertical line indicates the end of the audio-visual stimulus.