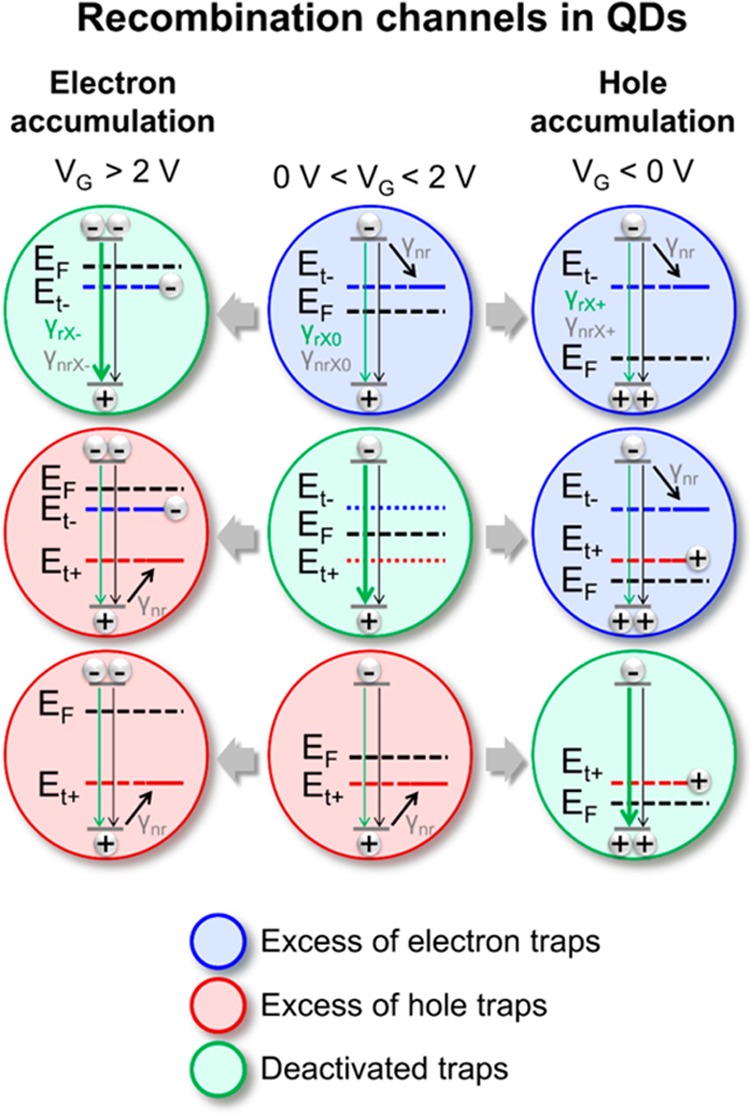
Figure 5.

Scheme of recombination channels in QDs. Middle column, initial conditions (0 V < VG < 2 V); left column, electron accumulation (VG > 2 V); and right column, hole accumulation (VG < 0 V). The colors of the schematic QDs indicate an excess of electron (blue) or hole (red) trap states (Et– and Et+) with an effective trapping rate γnr. The QDs with deactivated trap states are shown in green. The relative position of the Fermi level (EF) is defined by the gate voltage and turns numerous nonemissive QDs into QDs with more efficient trion emission (with radiative γrX–, γrX+ and nonradiative γnrX–, γnrX+ decay rates).
