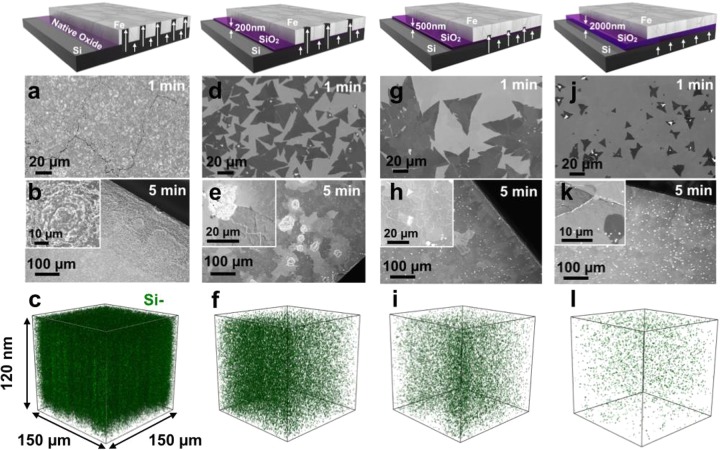
Figure 3.
Schematics of the catalyst system and SEM images of the surface after growth at 940 °C and 3 × 10⁻³ mbar borazine exposure for 1 min (a,d,g,j) and 5 min (b,e,h,k) for Fe/SiO2(x)/Si substrates, where x = native, 200, 500, and 2000 nm, respectively. SIMS 3D maps (c,f,i,l) showing the Si distributions in top 120 nm of the surface, corresponding to the samples respectively shown in (a,d,g,j).

