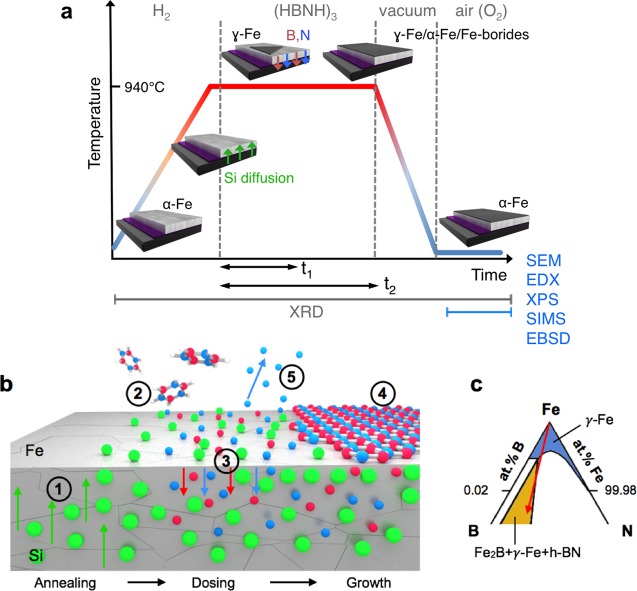
Figure 5.
(a) Schematic illustrating the salient stages of the CVD process for the conditions used in this work. The 3D diagrams depict the state of the catalyst system during these steps, and the green, red, and blue arrows indicate the incorporation of Si, B and N into the Fe bulk, respectively. We note that the Fe undergoes a phase transformation during annealing, which reverts either upon cooling after short borazine exposure times (t1) or isothermally at temperature for longer borazine exposure times (t2). The gray labels on the bottom of the schematic indicate at which stages the various characterization techniques were performed. (b) Schematic of the growth model for h-BN CVD on Fe/SiO2/Si substrates: (1) Annealing: onset of Si diffusion into the catalyst; (2) exposure: the borazine molecules impinge on the surface where they dehydrogenate and dissociate; (3) B and N species diffuse into the Fe catalyst; (4) nucleation and growth of h-BN; (5) possible desorption of surface N to gas phase. (c) detail of the Fe-rich corner of the Fe–B–N ternary phase diagram in the isothermal section at 950 °C.49 The blue region corresponds to the solid solution of B and N in γ-Fe. The yellow region corresponds the three-phase equilibrium of Fe2B, γ-Fe, and h-BN. The red arrow indicates the suggested reaction pathway during CVD of h-BN on Fe films.

