Figure 1.
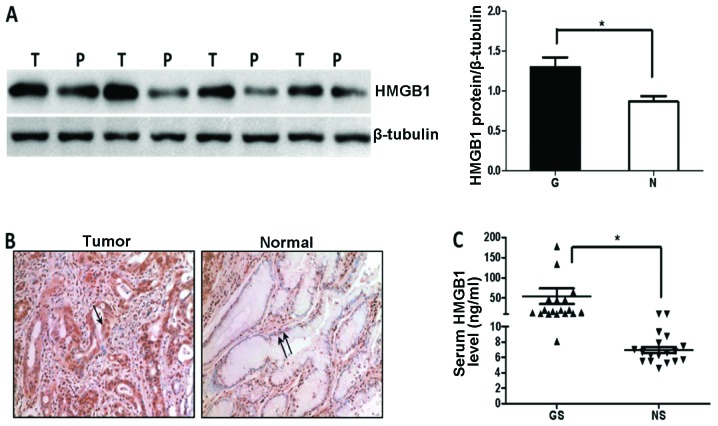
Expression of HMGB1 in gastric cancer tissues and serum. (A) HMGB1 protein levels were determined by western blot analysis in the non-tumorous and tumor tissues. Results were normalized to β-tubulin. Each value represents the average of 8 cases (*P=0.0101). (B) Immunohistochemistry of paraffin-embedded gastric tumor (n=30) and peritumor samples (n=23). HMGB1 in cytoplasm (arrows) and in the nucleus (double arrows) (x400 magnification). (C) HMGB1 expression in serum of gastric cancer patients (n=19) and healthy controls (n=18) was detected by ELISA, expressed as the mean ± SEM. Each triangle represents an individual patient; bars indicate the mean (*P=0.023). HMGB1, high mobility group box-B1. GS, gastric cancer serum; NS, normal serum from healthy individuals.

