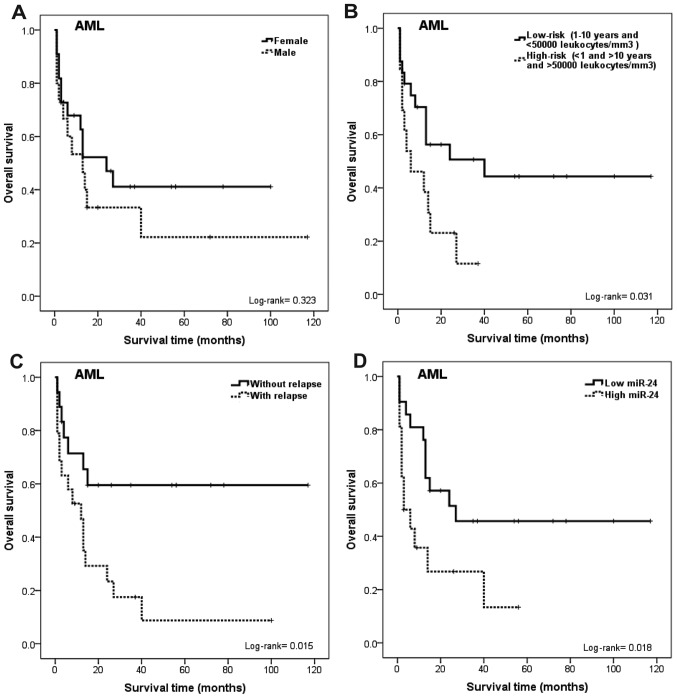
Figure 3.
Kaplan-Meier curves for overall survival time considering the influence of gender, risk by age and leukocyte count at diagnosis, relapse and miR-24 expression of AML patients. (A) OS in females and males with AML. Shorter OS for male than female patients was noted (although it was not statistically significant, p=0.323). (B) OS between patients with low-risk (1–10 years of age and <50,000 leukocytes/mm3) and high-risk (<1 and >10 years of age and >50,000 leukocytes/mm3). Significantly longer OS for patients with a low-risk than patients with high-risk (p=0.031). (C) OS between patients with and without relapse. Significantly shorter OS for patients with relapse than patients without relapse was noted (p=0.015). (D) OS significantly shorter for patients with high miR-24 expression than for those with low miR-24 expression (p=0.018). AML, acute myeloblastic leukemia; OS, overall survival.

