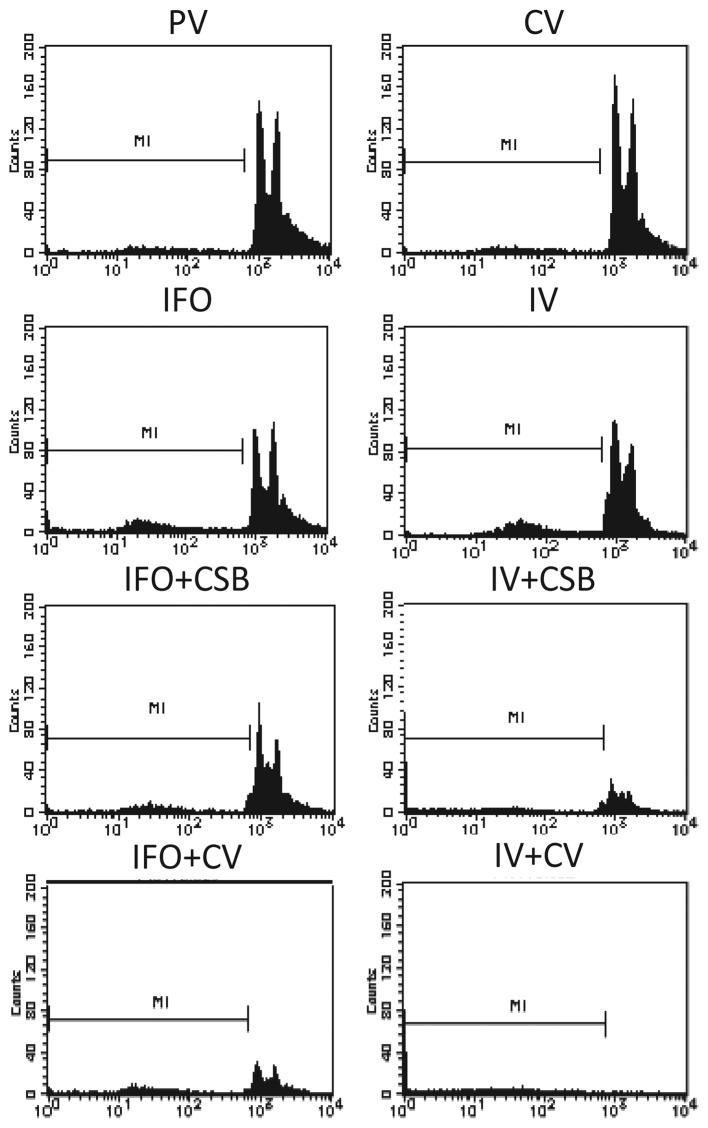
Figure 3.
Flow cytometric analyses of apoptosis using PI staining. Each graph shows the event count at each intensity according to the antitumor agent. The proportion of the population (%) of apoptotic and/or necrotic cells was measured as M1 and is presented in Table II.

