Figure 4.

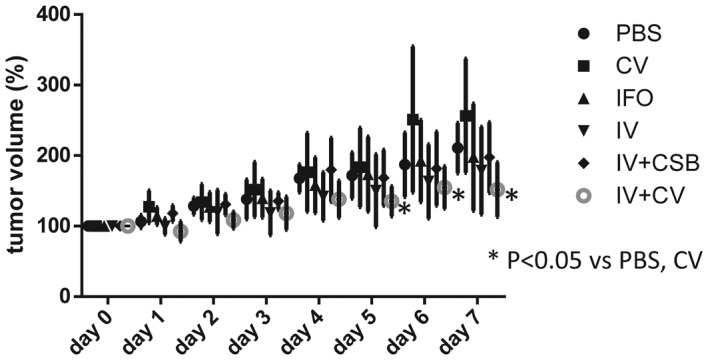
Trace of tumor volumes after antitumor agent administration. The symbols represent the mean value of each group, and the bars represent standard deviation.

Trace of tumor volumes after antitumor agent administration. The symbols represent the mean value of each group, and the bars represent standard deviation.