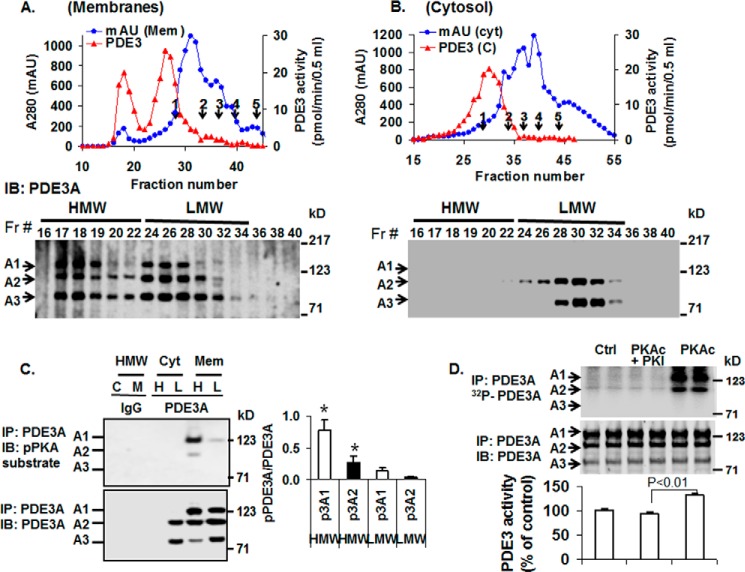
FIGURE 3.
Analysis of PDE3A isoforms by S6 gel filtration chromatography of solubilized human myocardial membrane or cytosolic fractions. Upper panels: A and B, solubilized myocardial (myc) membranes (A) and cytosolic (cyt) fractions (Fr; B) were prepared (3 mg of protein, 1 ml) and subjected to chromatography on Superose 6 columns. Portions (10 μl) of fractions (0.5 ml) were assayed for PDE3 activity (▴) (pmol of cAMP hydrolyzed/min/0.5 ml) and protein content (milliabsorption units (mAU)) 280 nm) (●). Molecular mass standard peaks are indicated: 1, thyroglobulin (670 kDa); 2, γ-globulin (158 kDa); 3, ovalbumin (44 kDa); 4, myoglobin (17 kDa); 5, vitamin B12 (1.35 kDa). IB, immunoblot. Lower panels: A and B, portions (20 μl) of the indicated fractions were subjected to SDS/PAGE and immunoblotted with anti-PDE3A-CT antibodies. One representative experiment is shown (n = 3). C, as described under “Methods,” portions of pooled HMW (H) and LMW (L) fractions (Fig. 3, A and B) from cytosol (C) and solubilized membrane (M) fractions were cleared by incubation with 5 μg non-immune rabbit IgG and 50 μl of Protein G magnetic beads. The beads were removed by placing the tubes in a magnetic stand, and the cleared fractions were then incubated with 10 μg of non-immune IgG (IgG) or 10 μg of anti-PDE3A-CT (PDE3A) as indicated. Fractions were subjected to immunoprecipitation (IP) with 50 μl Protein G magnetic beads, which were separated from the HMW and LMW fractions as described above. The beads were washed, and proteins were eluted from the beads by boiling with Laemmli SDS sample buffer. Portions (15–20 μl) of the eluted proteins were subjected to SDS/PAGE and immunoblotted with anti-phospho-PKA-substrate (upper panel) and anti-PDE3A-CT (lower panel) antibodies. PDE3A and pPDE3A were detected in immunoprecipitates from cleared HMW and LMW fractions incubated with anti-PDE3A-CT but not non-immune IgG. Bar graph, right panel, pPDE3A1/PDE3A1 (p3A1/3A1) and pPDE3A2/PDE3A2 (p3A2/3A2) ratios in HMW and LMW peaks indicated that endogenous PDE3A1 (HMW peak) was the most highly PKA-phosphorylated isoform and demonstrated an ≈8-fold increase in phosphorylation of PDE3A1 and ∼5-fold increase in phosphorylation of PDE3A2 in HMW peaks compared with LMW peaks (*, p < 0.01). Results are representative of three individual experiments. D, as described under “Methods,” PDE3A was immunoprecipitated by incubation of cleared solubilized myocardial membranes with anti-PDE3A-CT and Protein G magnetic beads. The beads containing immunoprecipitated PDE3A were separated from the solubilized membranes, washed, and incubated as indicated without (Ctrl) or with 250 units of rPKAc or 250 units rPKAc plus 10 μm PKI (PKAc inhibitor peptide) in phosphorylation buffer containing 200 μm ATP and 5 mm MgCl2 supplemented with (upper panel) or without (lower panel) [γ-32P]ATP. Upper panel, after incubation in phosphorylation buffer containing [γ-32P]ATP, the beads containing immunoprecipitated PDE3A were separated from reaction mixtures and washed, and 32P-labeled proteins were eluted from the beads by boiling with Laemmli SDS sample buffer. Portions (15–20 μl) of the eluted proteins were subjected to SDS/PAGE. γ-32P phosphorylation of PDE3A was detected by scanning the wet gels by phosphorimaging (GE Healthcare). Phosphorylation was blocked by PKI. Middle panel, proteins on wet gels were then electrophoretically transferred to nitrocellulose membranes, and PDE3A was identified by Western blotting using anti-PDE3A-CT antibody. Lower panel, PDE3 activity was assayed in PDE3A immunoprecipitates incubated with or without rPKAc and PKI in the absence of [γ-32P]ATP. Results are expressed as pmol of cAMP hydrolyzed/min. Shown are representative data from three independent experiments. rPKAc significantly increased PDE3A activity (p < 0.01); activation was blocked by PKI (PKAc inhibitor peptide).

