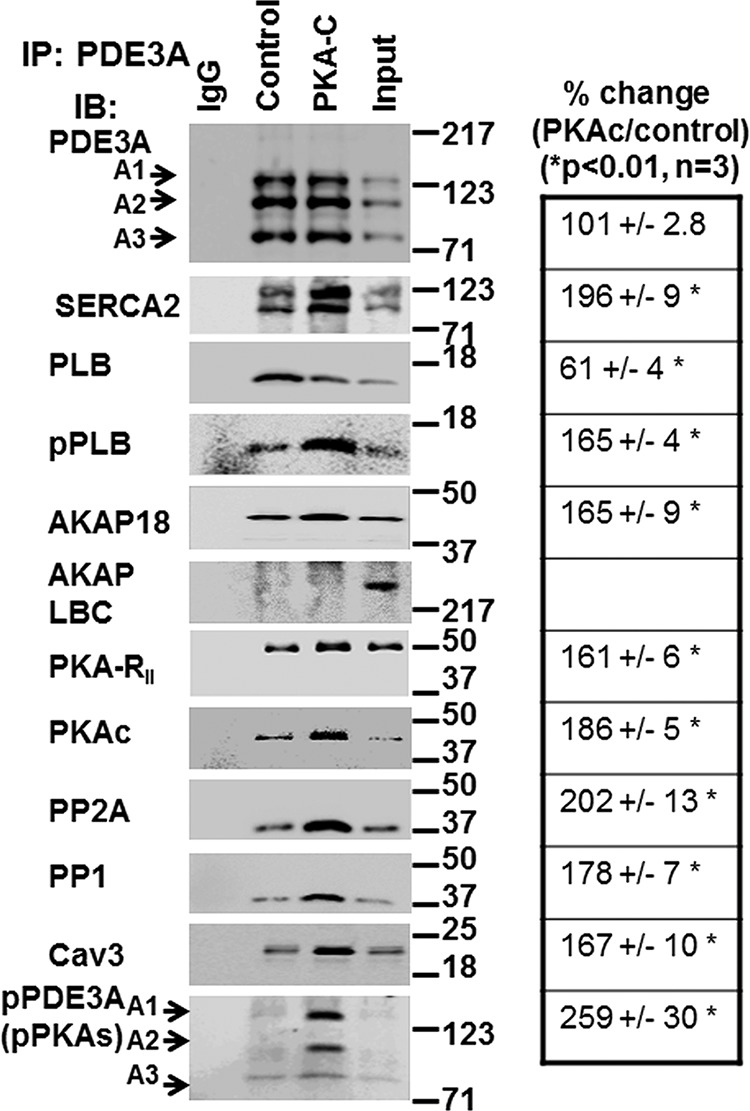
FIGURE 5.

rPKAc promotes interactions of PDE3A with components of the SERCA2 regulatory signalosome. Solubilized myocardial membranes were prepared (3 mg of protein, 1 ml) and subjected to chromatography on Superose 6 columns as in Fig. 3A. Membrane LMW fractions were pooled from two different experiments (Fig. 3A) and concentrated via Centriprep YM-3. Pooled, concentrated fractions were split into three fractions and incubated in phosphorylation buffer with 200 μm ATP and 5 mm MgCl2 for 1 h at 30 °C in the absence (IgG, Control) or presence (PKA-C) of rPKAc. At the completion of these reactions, fractions were cleared with non-immune IgG and Protein G magnetic beads as described above and then incubated (overnight, 4 °C) with non-immune IgG (IgG) or anti-PDE3A-CT antibody (control, PKA-C) before incubation and immunoprecipitation (IP) with Protein G magnetic beads (1 h, 4 °C). Proteins associated with the Protein G magnetic beads were eluted by boiling in 200 μl of Laemmli SDS sample buffer. Samples (15 μl) were subjected to SDS/PAGE and immunoblotted (IB) with specific antibodies as shown. Input membrane proteins (10 μg) were also loaded on the gels as positive controls. Representative results from three independent experiments are shown. Similar amounts of PDE3A were immunoprecipitated in the control fractions and in fractions incubated with rPKAc. Band intensities of immunoprecipitated PDE3A and its interacting signaling molecules were analyzed using an LAS3000 analyzer and presented as binding percentage ratios of signaling molecules (rPKAc/control). For PDE3A, band intensities of pPDEA1/pPDE3A2/pPDE3A3 in PKAc/control percentage ratios were calculated. *, p < 0.01 versus control (n = 3 independent experiments) Cav3, caveolin 3.
