FIGURE 6.
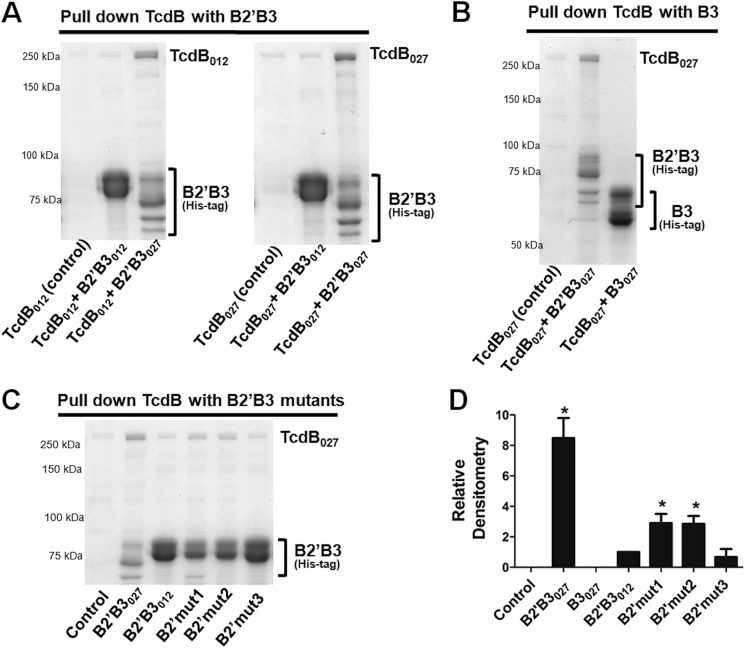
Analysis of interactions between full-length TcdB and the B2′B3 domain. Pull-down experiments were utilized to examine binding between full-length TcdB and B2′B3. These experiments were carried out with TcdB purified from C. difficile and recombinant His-tagged B2′B3 purified from E. coli. Incubations were done for 1 h at 37 °C with 450 nm TcdB and 2 μm B2′B3. His-tagged B2′B3 was pulled down with cobalt-coated magnetic beads, and binding between B2′B3 and TcdB was visualized by SDS-PAGE and Coomassie staining. A, SDS-PAGE demonstrating binding between B2′B3 and TcdB from different ribotypes. B, SDS-PAGE depicting lack of binding between B3027 and TcdB027. C, SDS-PAGE examining binding between TcdB027 and mutant forms of B2′B3 described in the legend to Fig. 1C. D, the bar graph represents the densitometry analysis of three Coomassie-stained gels from the data in A–C. Results are presented as mean (n = 3) ± S.D. (error bars). Asterisks indicate significance when compared with B2′B3012. *, p < 0.01.

