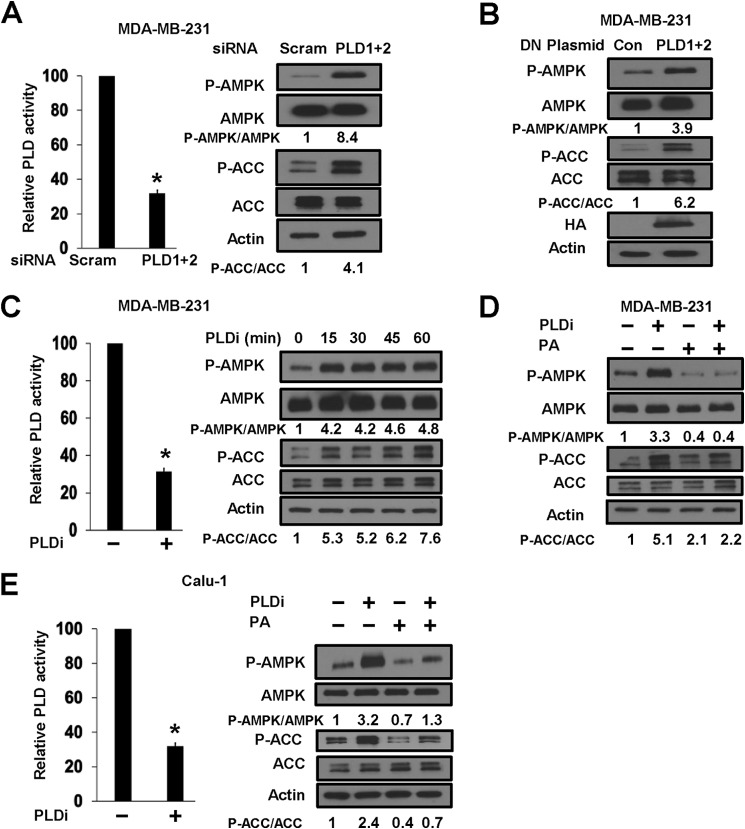
FIGURE 3.
Inhibition of PLD activates AMPK. A, MDA-MB-231 cells were plated as described for Fig. 2B and transfected with PLD1 and PLD2 siRNAs or a scrambled (scram) control siRNA as indicated. 6 h later, the cells were treated with fresh medium containing 10% serum for an additional 72 h. The cells were then harvested, and PLD activity was evaluated as described under “Experimental Procedures”. Values were normalized to the control scrambled siRNAs, which were given a value of 100%. For Western blot analysis, cells were harvested at 72 h, and the levels of phospho-AMPK (P-AMPK), AMPK, phospho-ACC (P-ACC), ACC, and actin were determined. B, MDA-MB-231 cells were plated as described for A and transfected with vectors expressing catalytically inactive dominant-negative (DN) mutant forms of PLD1 and PLD2. The parental vector pcDNA3.1 was used as control (Con). 48 h later, the cells were harvested, and the levels of phospho-AMPK, AMPK, phospho-ACC, and ACC were determined as described for A. Expression of PLD mutants was evaluated by probing the blots for HA tags on the PLD mutants. Blots were also probed for actin as loading controls. C, MDA-MB-231 cells were plated, the PLD1 and PLD2 inhibitors (PLDi; 10 μm each) were added for 1 h, and the relative PLD activity was then determined as described for Fig. 1C. The concentrations used were based on a previous study in which we used these inhibitors to block mTOR (24). For Western blot analysis, MDA-MB-231 cells were plated and treated with the PLD inhibitors for the indicated times. Cells were harvested, and the levels of phospho-AMPK, AMPK, phospho-ACC, ACC, and actin were determined as described for A. D, MDA-MB-231 cells were plated as described for C and treated with the PLD inhibitors and/or PA for 45 min as indicated. The cells were then harvested, and the levels of phospho-AMPK, AMPK, phospho-ACC, ACC, and actin were determined as described for A. E, Calu-1 cells were plated, and the PLD inhibitors (10 μm each) were added for 1 h. The relative PLD activity was then determined as described for Fig. 1C. For Western blot analysis, Calu-1 cells were plated as described for C and treated with the PLD inhibitors and/or PA for 45 min as indicated. The cells were then harvested, and the levels of phospho-AMPK, AMPK, phospho-ACC, ACC, and actin were determined as described for A. The Western blot data are representative of experiments repeated at least two times. Error bars for PLD assays represent S.D. for at least two independent experiments. The statistical significance (p value) was determined by Student's two-tailed paired t test. *, p ≤ 0.01 compared with the control. The relative levels of AMPK and ACC phosphorylation were normalized to total AMPK and total ACC, respectively, and quantified as described for Fig. 1A.

