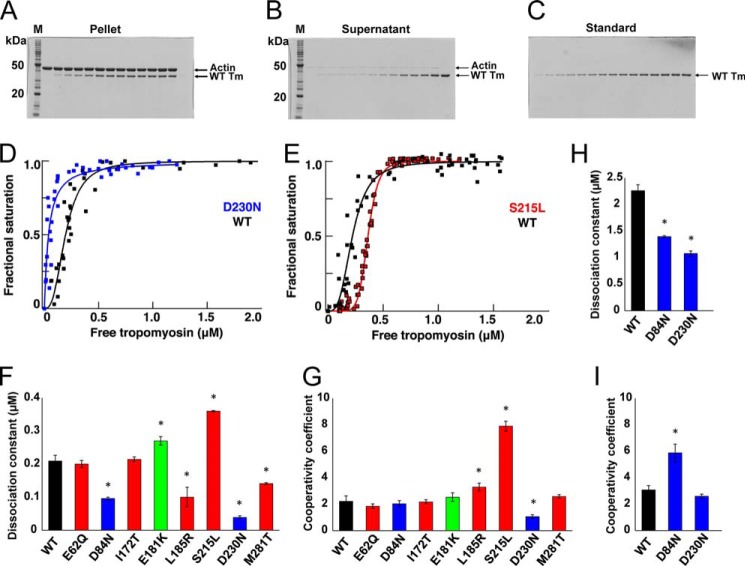
FIGURE 3.
Actin-Tm binding. A–C, SDS-PAGE of representative actin-WT Tm cosedimentation assay. A, pellets. B, supernatants. C, standards for quantitation. D–G, binding of Tm to actin. D, DCM mutant D230N (blue); E, HCM mutant S215L (red) relative to WT control (black). F, dissociation constants; G, cooperativity of the binding (mean ± S.E.) for mutants relative to WT Tm in 100 mm KCl (*, p < 0.05 by t test). Values are in Table 2. H and I, dissociation constants and cooperativity of the binding (mean ± S.E.) for DCM mutants, D84N, and D230N relative to WT at 200 mm KCl.

