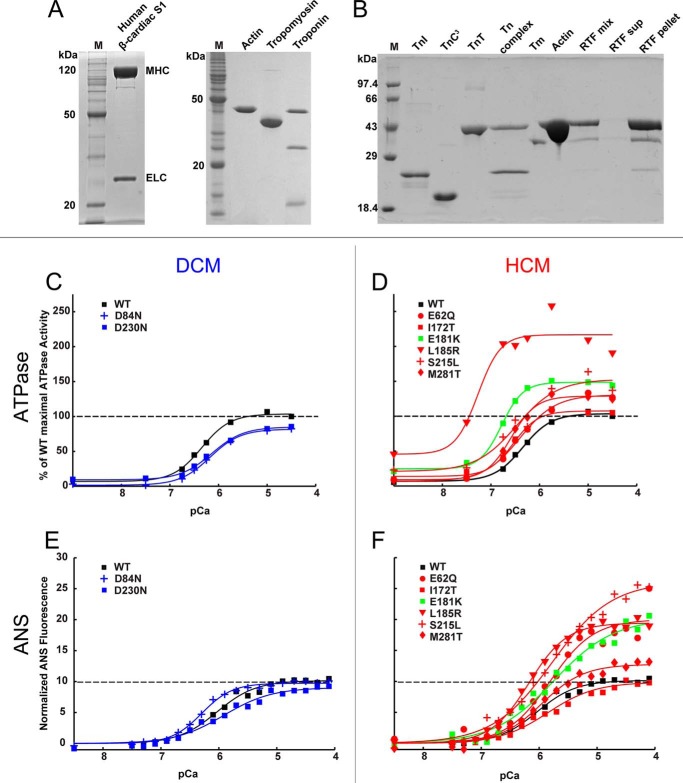
FIGURE 5.
Ca2+ sensitivity. A and B, representative SDS-PAGE of proteins used for in vitro assays. Lane M, molecular mass marker. A, purified human β-cardiac S1 from C2C12 cells, actin from chicken skeletal muscle, human α Tm from E. coli, and human Tn from E. coli. B, purified Tns and reconstitution of components into regulated thin filaments. C, DCM mutants D84N and D230N (blue) shift the pCa50 of RTF-stimulated ATPase activity to the right relative to WT (black). D, HCM mutants (red) and predicted HCM mutant E181K (green) shift the pCa50 to the left. E, DCM mutants D84N and D230N (blue) do not significantly change the ANS fluorescence response to Ca2+ relative to WT (black). F, all HCM mutants (except I172T) have increased changes in ANS fluorescence relative to WT. Values are in Tables 3 and 4. All graphs were best fit to mean ± S.E. from ≥3 experiments. The maximum S.E. for ATPase was 11 units and for ANS assay was 4 units of the y axis.

