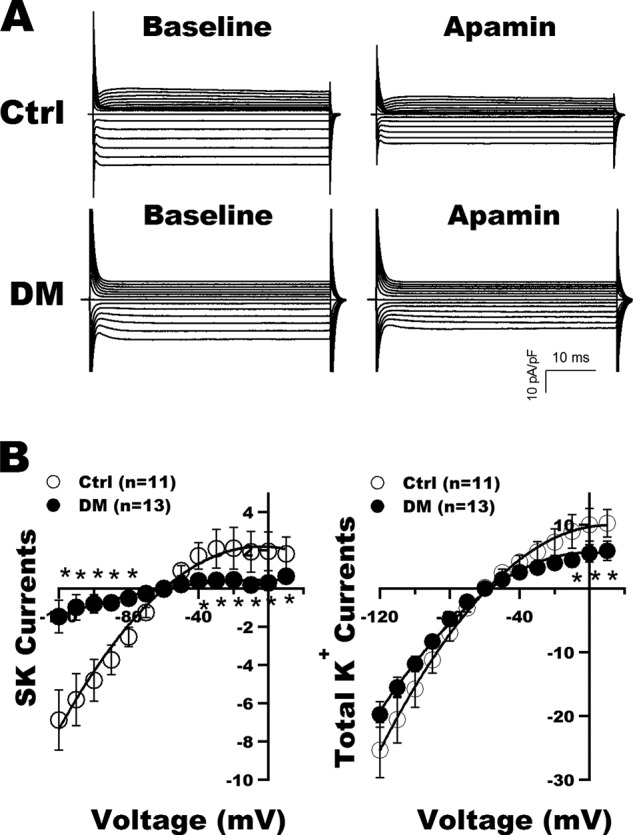
FIGURE 3.

SK current recordings in atrial myocytes from control and DM mice. A, representative tracings of whole-cell K+ currents recorded in freshly isolated atrial myocytes from control (Ctrl) and diabetic mice before (Baseline) and after exposure to apamin (100 pm). B, left panel, the current-voltage relationships of SK currents (defined as K+ currents sensitive to 100 pm apamin) showed marked reduction in current densities over a wide range of testing potentials in the diabetic myocytes compared with controls. Right panel, the current-voltage relationship of total K+ currents showed a significant decrease of the total outward K+ current densities from +10 to −10 mV in diabetic atrial myocytes compared with controls. * represents p < 0.05 versus controls. Error bars represent S.E. pF, picofarad.
