FIGURE 4.
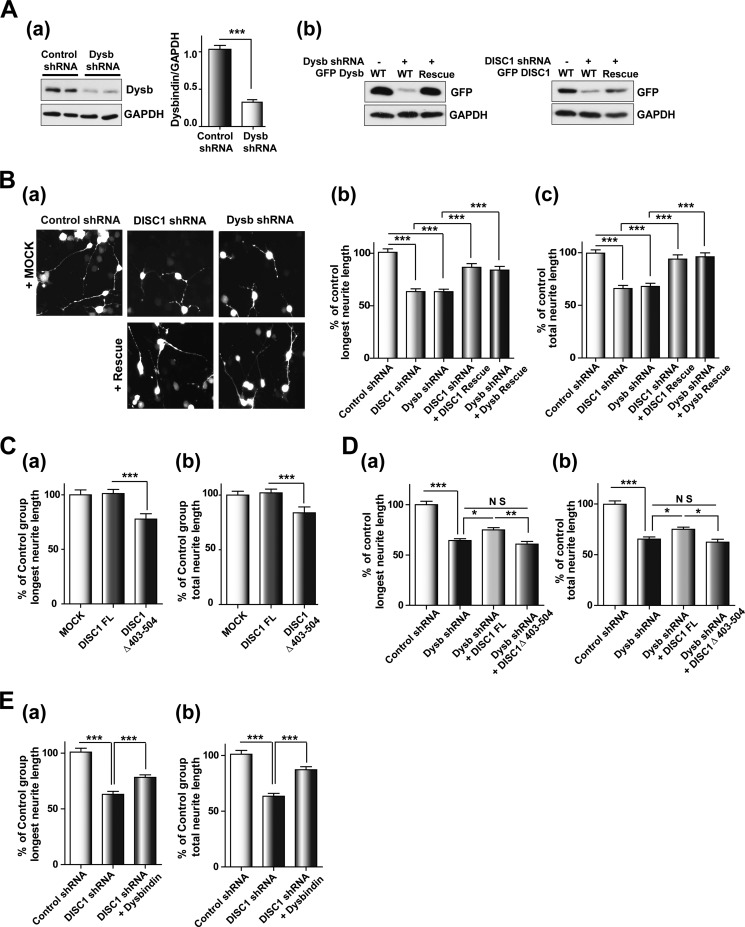
DISC1 affects the dysbindin-mediated neurite outgrowth process. A, characterization of shRNA constructs. a, knockdown of endogenous dysbindin (Dysb) by dysbindin shRNA in differentiated CAD cells (n = 3). Error bars show mean ± S.E. ***, p < 0.001 by Student's t test. b, expression of shRNA-resistant DISC1 and dysbindin. B, neurite outgrowth defects in DISC1 and dysbindin knockdown CAD cells. Shown are representative images of differentiated CAD cells transfected with shRNA constructs alone or in combination with rescue constructs of DISC1 and dysbindin (a). The longest neurite length (b) and total neurite length (c) were measured using ImageJ software and normalized to the control group (n = 243 for control shRNA, n = 237 for DISC1 shRNA, n = 245 for dysbindin shRNA, n = 215 for DISC1 shRNA + DISC1 rescue, and n = 217 for dysbindin shRNA + dysbindin rescue). Error bars show mean ± S.E. ***, p < 0.001 by one-way ANOVA with Bonferroni's multiple comparison test. C, inhibition of neurite outgrowth by coexpression of DISC1Δ403–504. The longest neurite length (a) and total neurite length (b) were analyzed in CAD cells differentiated 3 days (n = 193 for MOCK, n = 237 for DISC1 FL, and n = 223 for DISC1Δ403–504). Error bars show mean ± S.E. ***, p < 0.001 by one-way ANOVA with Bonferroni's multiple comparison test. D, partial rescue of the dysbindin knockdown phenotype by coexpression of DISC1. The longest neurite length (a) and total neurite length (b) are shown (n = 211 for control shRNA, n = 210 for dysbindin shRNA, n = 193 for dysbindin shRNA + DISC1 FL, and n = 106 for dysbindin shRNA + DISC1Δ403–504). Error bars show mean ± S.E. *, p < 0.05; **, p < 0.01; ***, p < 0.001; NS, not significant by one-way ANOVA with Bonferroni's multiple comparison test. E, reversal of the neurite outgrowth defects by dysbindin coexpression in DISC1 knockdown cells. The longest neurite length (a) and total neurite length (b) are shown (n = 192 for control shRNA, n = 219 for DISC1 shRNA, and n = 219 for DISC1 shRNA + dysbindin). Error bars show mean ± S.E. ***, p < 0.001 by one-way ANOVA with Bonferroni's multiple comparison test.

