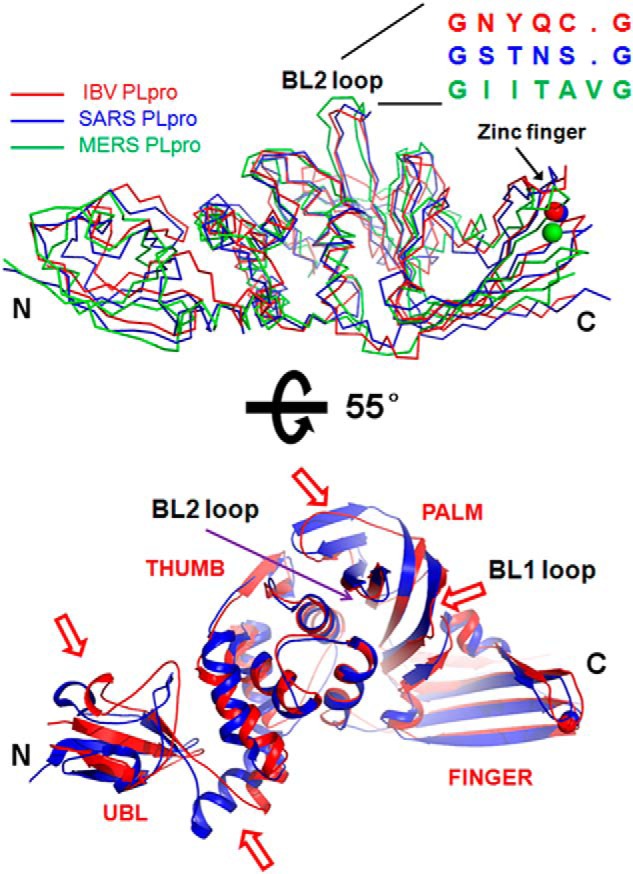
FIGURE 2.

Comparison of the overall structures of PLpros from different CoVs. A, crystal structures of PLpros from SARS CoV (blue ribbon; Protein Data Bank code 4M0W) (19) and MERS (green ribbon; Protein Data Bank code 4RF1) CoVs (36) were superimposed over the structure of PLpro from IBV (red ribbon). The location of BL2 and the primary sequences of the PLpros corresponding to this region are shown. Zn2+ ion is shown as a sphere. B, superimposition of the structures of PLpro from SARS CoV (blue schematic) over IBV PLpro (red schematic). The view is the same as in A but rotated by 55° around the x axis. Regions that show significant deviation are marked by a red arrow. The N and C termini of the protein are marked as N and C, respectively.
