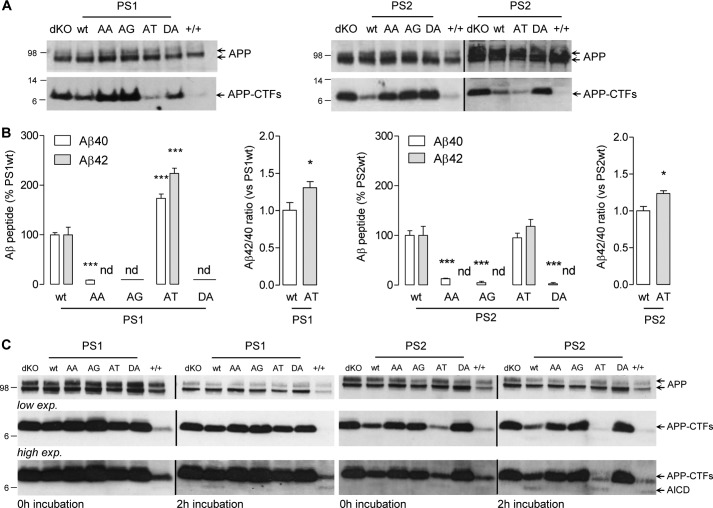
FIGURE 4.
Effects of PS AXXXAXXXG motifs mutations on endogenous APP processing Aβ production and AICD release. A, Western blot of cell lysates from MEFPSdKO PS1 (left) and PS2 (right) rescued cells revealed with an anti-APP C-ter antibody, compared with MEF+/+ (+/+) and MEFPSdKO (dKO). Bands corresponding to APP and APP α- or β-C-terminal fragments (APP-CTFs) are indicated by arrows. B, quantification of Aβ40 and Aβ42 concentrations in the extracellular media and the corresponding Aβ42/Aβ40 reported in PS-WT and PS-AT constructs. Results (means ± S.E. (error bars)) are given as a percentage of Aβ or Aβ42/Aβ40 measured in PS-WT cell medium (n = 3). nd, non-detectable; ***, p < 0.0001 as compared with +/+; ###, p < 0.0001 as compared with PS-WT. Statistical analyses on Aβ quantification were performed by one-way ANOVA followed by Dunnett's post hoc test, whereas analyses of Aβ42/Aβ40 ratio were performed by the Mann-Whitney test. C, AICD production measured by cell-free assays on solubilized membranes from MEFPSdKO (dKO), MEF+/+ (+/+), and MEFPSdKO stably rescued with the indicated PS1 or PS2 isoforms. AICD release was monitored before (0 h) and after 2 h of incubation by Western blotting using an anti-APP C-ter antibody. Lower (low exp.) and higher (high exp.) exposures of the same blots are shown.

