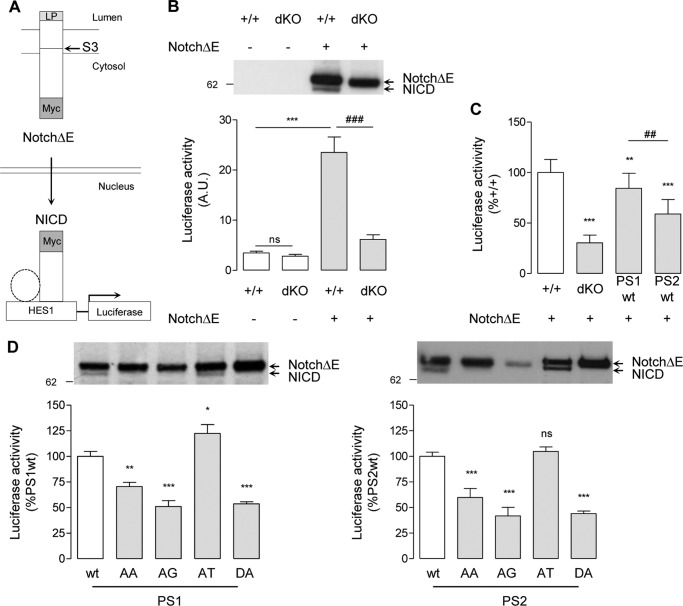
FIGURE 7.
Effects of PS AXXXAXXXG motifs in Notch γ-cleavage and NICD release. A, schematic representation of gene transactivation assay used to monitor NICD production. LP, Notch leader peptide. Other transcriptional co-activators associated with NICD (e.g. CSL and MAML1) are represented by a dotted circle. Cells were co-transfected with a HES1 luciferase reporter gene, with pRL-TK Renilla plasmid, and, where specified, with a Myc-tagged ΔE-Notch construct (NotchΔE). When overexpressed, NotchΔE is cleaved by γ-secretase at the S3 site, and the Myc-tagged NICD released translocates into the nucleus, where it transactivates the HES1 reporter gene. B, MEF+/+ (+/+) and MEFPSdKO (dKO) were co-transfected in the presence or absence of NotchΔE as specified. Western blots (top) of cell extracts were revealed with anti-Myc antibody. The bands corresponding to NotchΔE and its derived NICD are indicated by arrows. Luciferase activity (bottom) was measured in the same cell extracts. Results (means ± S.E.) are given as percentage of luciferase activity measured in +/+ cells. ns, non significant; ***, p < 0.0001, as compared with +/+; ###, p < 0.0001 as compared with NotchΔE-expressing +/+ cells (n = 4). C, the same assay was performed on +/+, dKO, and PS1-WT and PS2-WT cells. Results (means ± S.E. (error bars)) are given as a percentage of luciferase activity measured in +/+ cells. **, p < 0.01; ***, p < 0.0001, as compared with +/+; ###, p < 0.0001 as compared with PS1-WT (n = 4). D, analysis of NICD production and release of MEFPSdKO rescued for PS1 (left) and PS2 isoforms (right). Western blots of cell extracts revealed by anti-Myc antibody. The bands corresponding to NotchΔE and its derived NICD are indicated by arrows. Luciferase activity (bottom) was measured in the same cell extracts. Results (means ± S.E.) are given as a percentage of activity measured in the WT controls (PS1-WT or PS2-WT); *, p < 0.05; **, p < 0.01; ***, p < 0.0001 (PS1, n = 3; PS2, n = 5). All statistical analyses were performed by one-way ANOVA followed by Dunnett's post hoc test.

