
FIGURE 11.
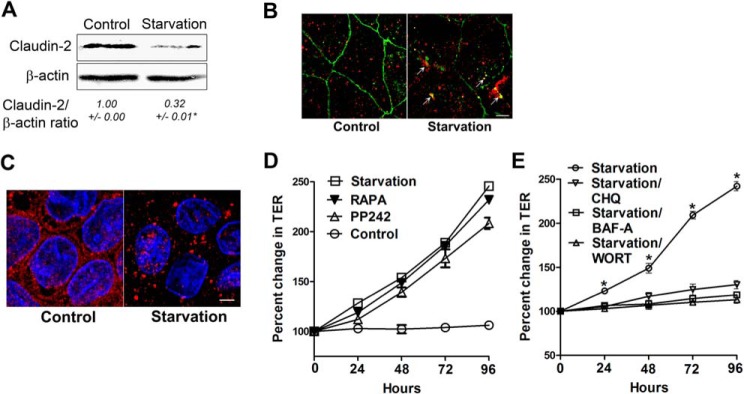
Starvation induces autophagy and enhances the TJ barrier in a claudin-2-dependent manner in MDCK II cells. A, in a Western blot analysis, starvation reduced the claudin-2 protein level (representation of three blots, 96 h of starvation) (*, p < 0.01 versus control). B, confocal immunofluorescence of claudin-2 shows loss of claudin-2 (green) staining from the membrane and colocalization with the lysosomal marker LAMP2 (red, arrows). Shown is a representation of 96 h of starvation. Scale bar = 5 μm. C, confocal immunofluorescence for LC3 staining in starved MDCK II cells showed cytoplasmic punctum formation. Scale bar = 5 μm. Shown is a representation of 48 h of starvation. D, incubation of MDCK II cells in normal medium with the mTOR inhibitors rapamycin (RAPA) and PP242 (500 nm) increased the TER, comparable with cells in starvation medium. E, incubation of MDCK II cells in starvation medium with the autophagy inhibitors bafilomycin A (BAF-A), chloroquine (CHQ), and wortmannin (WORT) significantly inhibited the increase in TER caused by starvation alone. *, p < 0.01 versus all other groups.