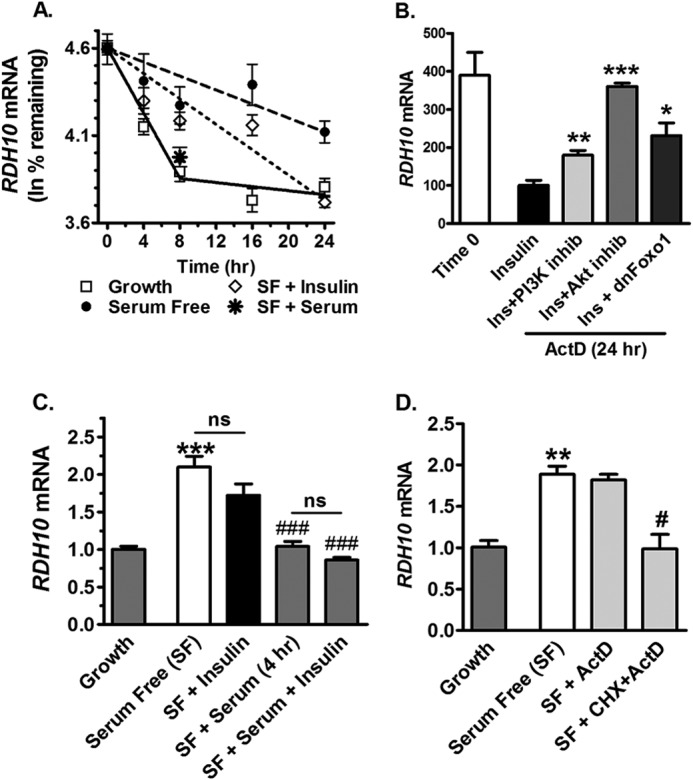
FIGURE 5.

Insulin and serum decrease the elimination half-life of RDH10 mRNA. A, HepG2 cells were maintained in growth medium, or incubated in serum-free (SF) medium 16 h before time 0. At time 0, cells were treated with 25 μg/ml of ActD in growth medium (solid line) or in serum-free medium with (short dashed line) or without (long dashed line) 10 nm insulin or 10% serum. qPCR data were normalized to 100% relative expression at time 0 for each condition and plotted as ln % remaining. Half-lives (t½) were calculated as 0.693/slope, with the slope determined by linear regression analysis. B, cells were maintained in growth medium or incubated in serum-free medium 16 h before time 0. At time 0, cells that were transitioned to serum-free medium were treated a further 24 h in serum-free medium with the addition of 25 μg/ml of ActD and 10 nm insulin, or insulin and 50 μm PI3K inhibitor (LY294002), or insulin and 1 μm Akt inhibitor (triciribine), or insulin and adenovirus expressing dominant-negative FoxO1 (dnFoxO1). Adenovirus treatment began 48 h prior to collection. qPCR data were normalized to 100% expression relative to the insulin-treated group. C, cells were maintained in growth medium, or incubated in serum-free medium 16 h, then treated 4 h with 10 nm insulin and/or 10% serum. D, cells were maintained in growth medium or preincubated in serum-free medium 16 h, then treated 8 h with dimethyl sulfoxide (vehicle control), 25 μg/ml of ActD or ActD, and 10 μg/ml of cycloheximide: *, p < 0.05; **, p < 0.005; ***, p < 0.0001 versus insulin values; **, p < 0.005; ***, p < 0.001 versus growth values; #, p < 0.05; ###, p < 0.001 versus serum-free values. ns, not significantly different from growth medium.
