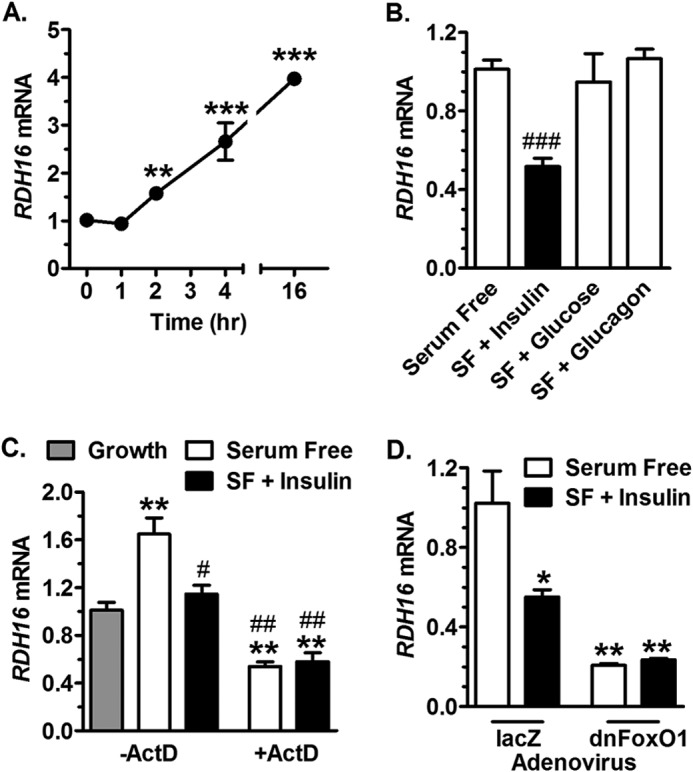
FIGURE 6.

Serum and insulin repress RDH16 expression in HepG2 cells. A, cells were transitioned from growth (serum-containing) medium to serum-free (SF) medium at time 0 and assayed by qPCR for RDH16 mRNA. B, cells were exposed to serum-free medium and treated with 10 nm insulin, 20 mm glucose, or 100 nm glucagon for 6 h. C, cells were exposed to growth or serum-free medium and treated 4 h with 10 nm insulin and/or 25 μg/ml of ActD. D, cells were infected 48 h with adenovirus expressing dnFoxO1 or lacZ, and treated with serum free-medium ± 10 nm insulin during the final 4 h: *, p < 0.05; **, p < 0.005; ***, p < 0.0005 versus growth values; #, p < 0.05; ##, p < 0.005; ###, p < 0.0005 versus serum-free values.
