
FIGURE 1—
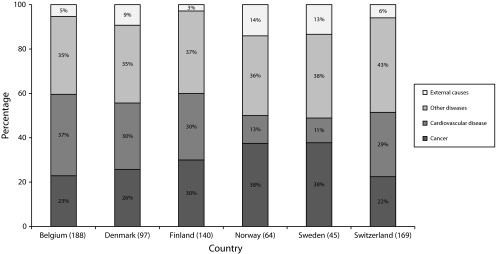
Contribution of specific causes of death to the change in US mortality (dis)advantage for women: United States and 7 European Countries, 1989–2003.
Note. Numbers in parentheses indicate absolute change in all-cause mortality.
Official websites use .gov
A
.gov website belongs to an official
government organization in the United States.
Secure .gov websites use HTTPS
A lock (
) or https:// means you've safely
connected to the .gov website. Share sensitive
information only on official, secure websites.
Contribution of specific causes of death to the change in US mortality (dis)advantage for women: United States and 7 European Countries, 1989–2003.
Note. Numbers in parentheses indicate absolute change in all-cause mortality.