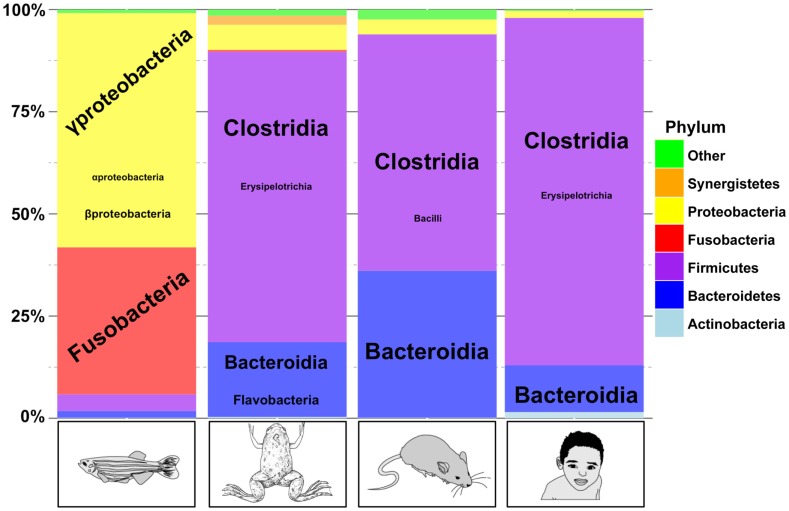
Figure 2.
A comparison of gut microbiome taxonomic profiles in fish, frog, mice, and human. Comparison between four adult vertebrate gut microbiomes. Phylum are represented by colors, and class for the most abundant phylum are represented according to the font size. This figure was adapted from Kostic et al. (121) and from available data on SRA database for H. sapiens (ERR139249) (122), M. musculus (SRR513991) (123), D. rerio (ERR012013) (124), and X. laevis (SRX247015) (57). Data were submitted to the Ribosomal Database Project Classifier tool for taxonomy classification (125). This graph was generated using R (http://cran.r-project.org/bin/).

