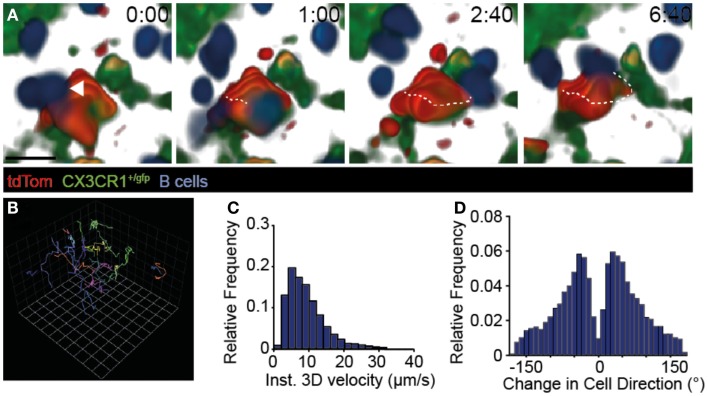
Figure 3.
Dynamic B cell behavior on TDA-coated FDCs. (A) 2PM image sequence showing B cell migration along tdTom+ structures 31–95 μm below the TDLN capsule in CX3CR1+/gfp recipients. A representative B cell track is shown as dotted line. Scale bar, 10 μm; time in minutes and seconds. (B) Representative tracks (>10 time points) of B cells migrating taken from the image sequence shown in A. One square corresponds to 11.2 μm. (C) Quantification of B cell speeds in TDLNs. (D) Quantification of turning angles of B cells in TDLNs. Data in (A–D) are from three mice in one experiment, with 433 B cell tracks analyzed.

