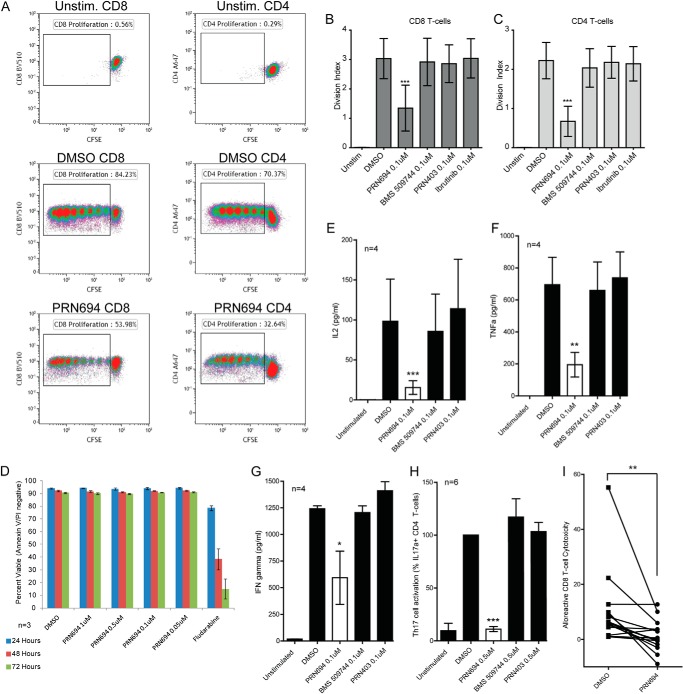
FIGURE 7.
PRN694 inhibits TCR-induced primary T-cell proliferation and proinflammatory cytokine production without direct cytotoxicity. CD3 T-cells isolated from healthy donors (n = 3) were stained with 1 μm CFSE; pretreated with 0.1 μm PRN694, 0.1 μm PRN869, 0.1 μm PRN403, or 0.1 μm ibrutinib for 30 min; and then incubated without or with anti-CD3/CD28 for 6 days. A, representative flow cytometry analysis of CFSE staining. Shown is a graphical representation of results for CD8 T-cells (B) and CD4 T-cells (C). The division index is the average number of cell divisions that a cell in the original population has undergone. D, cytotoxicity of PRN694 in primary healthy T-cells. CD3 T-cells were isolated from healthy donors (n = 3), pretreated with PRN694 as indicated, and analyzed by annexin/propidium iodide flow cytometry at 24, 48, and 72 h. Data show absolute percentages of CD3-positive cells negative for both annexin and propidium iodide. E–G, CD3 T-cells from healthy donors (n = 4) were pretreated with or without 0.1 μm PRN694, 0.1 μm BMS-509744, 0.1 μm PRN403, or vehicle (DMSO) for 30 min and then stimulated with anti-CD3/CD28 for 48 h. Cytokines, including IL-2 (E), TNF (F), and IFNγ (G), present in the supernatant were assayed by a cytometric bead assay. H, effect of PRN694 on TCR-induced Th17 activation. PBMCs from healthy donors (n = 6) were pre-enriched for CD4+/CXCR3−/CCR6+ cells, which include a high fraction of Th17 cells. These cells were pretreated with vehicle (DMSO), 0.5 μm PRN694, 0.5 μm BMS-509744, or 0.5 μm PRN403 and then stimulated with anti-CD3/anti-CD28 for 12 h. TCR-induced intracellular IL-17a was detected by flow cytometry. Data are shown as the percentage of IL-17a-positive CD4 T-cells normalized to DMSO. I, healthy primary CD8 T-cells were pretreated with 1 μm PRN694 or DMSO control and subsequently cultured at a 25:1 ratio with 51Cr-labeled allogeneic PBMCs for 4 h. Afterward, specific lysis of allogeneic PBMCs was quantified by measurement of released 51Cr as compared with maximum and minimum lysis controls. For all figures: *, p < 0.05, **, p < 0.01, ***, p < 0.001. Error bars, S.E.

