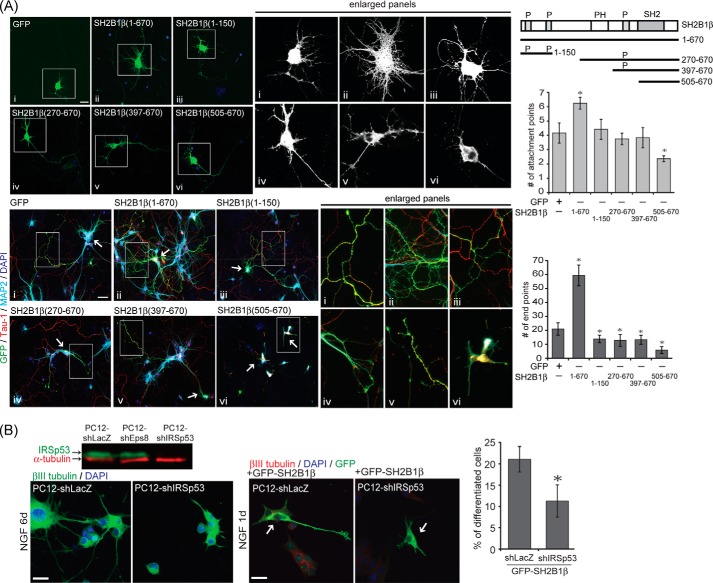
FIGURE 6.
Proline-rich domains of SH2B1β are required to enhance filopodium formation and neurite outgrowth in hippocampal neurons. A, schematics of full-length (1–670) and various truncated SH2B1β structures. Amino acid numbers are shown. Top two panels, GFP (panel i), full-length (panel ii), or truncated form (panels iii–vi) of SH2B1β constructs were transiently transfected to hippocampal neurons on DIV 3, and images of the live neurons were taken on DIV 7 using Zeiss Observer Z1 microscope. Enlarged images of the neurite branches and filopodium formation are shown on the right panels. Scale bar, 20 μm. A total of 15 cells were counted per condition from three independent experiments. Values are mean ± S.E. from three independent experiments (*, p < 0.05, Student's t test, overexpressing full-length and truncated form of SH2B1β constructs compared with GFP). Bottom two panels, GFP (panel i), full-length (panel ii), or truncated form (panels iii–vi) of SH2B1β constructs were transiently transfected to hippocampal neurons on DIV 4, and the morphology of the neurons was subjected to immunofluorescence staining with anti-MAP2 (light blue) and Tau-1 (red) antibodies together with DAPI (blue) on DIV 7. The arrows show the overexpression of GFP, full-length, or truncated form of SH2B1β in hippocampal neurons. Scale bar, 40 μm. B, PC12 cells stably expressing shLacZ (PC12-shLacZ) or shIRSp53 (PC12-shIRSp53) were established. Cell lysates from PC12-shLacZ, PC12-shEps8, and PC12-shIRSp53 cells were collected and immunoblotted with anti-IRSp53 and α-tubulin antibodies. Left two panels, PC12-shLacZ and PC12-shIRSp53 cells treated with 50 ng/ml NGF for 6 days were subjected to immunofluorescent staining with anti-βIII tubulin (green) antibody together with DAPI (blue). Scale bar, 20 μm. Right two panels, PC12-shLacZ and PC12-shIRSp53 cells were transiently transfected with GFP-SH2B1β and then treated with 50 ng/ml NGF for 1 day before immunofluorescent staining with anti-βIII tubulin (red) and GFP (green) antibodies together with DAPI (blue). The arrows show overexpression of GFP-SH2B1β in PC12-shLacZ and PC12-shIRSp53 cells. Scale bar, 20 μm. A total 100–105 cells were counted per condition from three independent experiments. Values are mean ± S.E. from three independent experiments (*, p < 0.05, Student's t test, PC12-shIRSp53 compared with PC12-shLacZ).

