FIGURE 3.
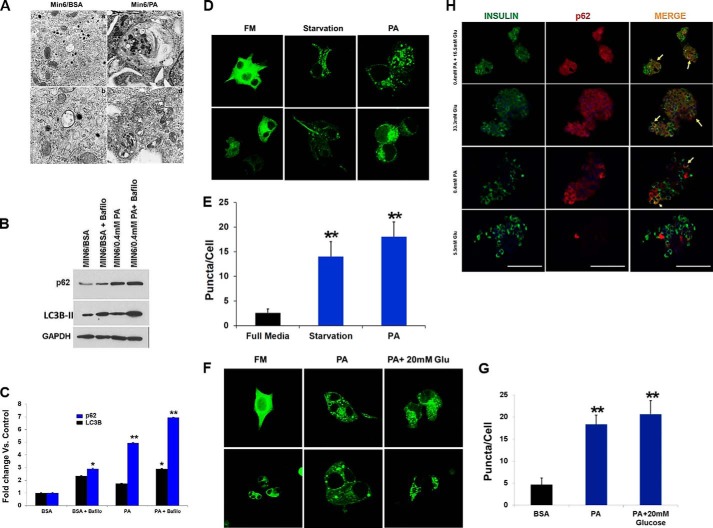
PA increases the number and size of the autophagosomes and autophagy substrates. A, micrographs of MIN6 cells revealed accumulation of autophagosomes in PA-treated cells (panels c and d) as compared with BSA controls (panels a and b). B, MIN6 cells were treated with 0.4 mm PA with or without 200 nm bafilomycin (for last 3 h of incubation) for 14 h. Western blot analysis of LC3B-II and p62 (n = 4) is shown. GAPDH was used as a loading control. C, quantification of triplicate experiments described in B, where the error bars represent standard deviation of triplicate measurements. The experiment was performed in quadruplicate. D, confocal images of MIN6 cells expressing GFP-LC3 treated for 14 h with full medium (FM), PA, or starvation medium. E, translocation of LC3B to AP was determined by formation of GFP autofluorescent dots, which were quantified. F, confocal images of MIN6 cells expressing WIPI-GFP and incubated for 16 h in control (FM) medium (5.5 mm glucose) or medium containing 0.4 mm PA alone or with 20 mm glucose. G, quantification of the AP number per cell as determined from confocal images of cells expressing WIPI-GFP. 35 cells were analyzed per condition. H, double staining for insulin (green) and p62 (red) of human pancreatic islets exposed to glucose (33.3 mm), PA (0.4 mm), glucose (16.5 mm), and PA (0.4 mm) for 48 h compared with control (5.5 mm) (n = 4). Nuclei are labeled by DAPI (blue). Co-localization of p62 and insulin-depleted β-cells is indicated by arrows. Scale bars represent 100 μm. Glu, glucose.

