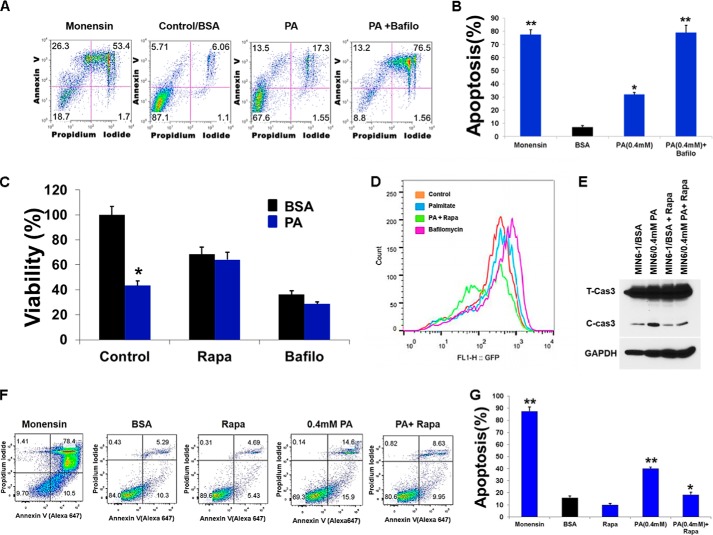
FIGURE 9.
Stimulation of autophagy decreases PA-induced cell death. MIN6 cells were co-treated with PA (0.4 mm) and autophagic inhibitors bafilomycin (200 nm) and monnesin (100 nm) for 16 h and then co-stained with propidium iodide and annexin V-FITC followed by flow cytometric analysis. A, representative scatter plot from flow cytometric analysis is shown. B, quantitation of annexin-positive cells. The error bars represent S.D. of the mean value from three independent experiments (*, p < 0.05; **, p < 0.01). C, MIN6 cells were co-treated with PA (0.4 mm), autophagic inhibitor bafilomycin (200 nm), and mTORC1 inhibitor rapamycin (200 nm) for 16 h, and cell viability was analyzed using Cell Titer-Glo luminescent cell viability assay. *, p < 0.05; **, p < 0.01 versus viability of BSA- and PA-treated cells. D, flow cytometry histogram of MIN6 cells expressing GFP-LC3 treated with PA (0.4 mm) for 16 h in the presence of autophagic inhibitor bafilomycin (200 nm) and mTORC1 inhibitor rapamycin (200 nm) added the last 3 h. E, MIN6 cells were treated with PA (0.4 mm) for 16 h in the presence or absence of rapamycin (200 nm), and lysates were analyzed by Western blot for cleaved caspase 3 and GAPDH (bottom panel). MIN6 cells were co-treated with PA (0.4 mm) and rapamycin (200 nm) for 16 h and then co-stained with propidium iodide and annexin V-FITC followed by flow cytometric analysis. F, representative scatter plot from flow cytometric analysis is shown. G, quantitation of annexin-positive cells. Error bars represent S.D. of the mean value from three independent experiments (*, p < 0.05, **, p < 0.01). Bafilo, bafilomycin; Rapa, rapamycin.

