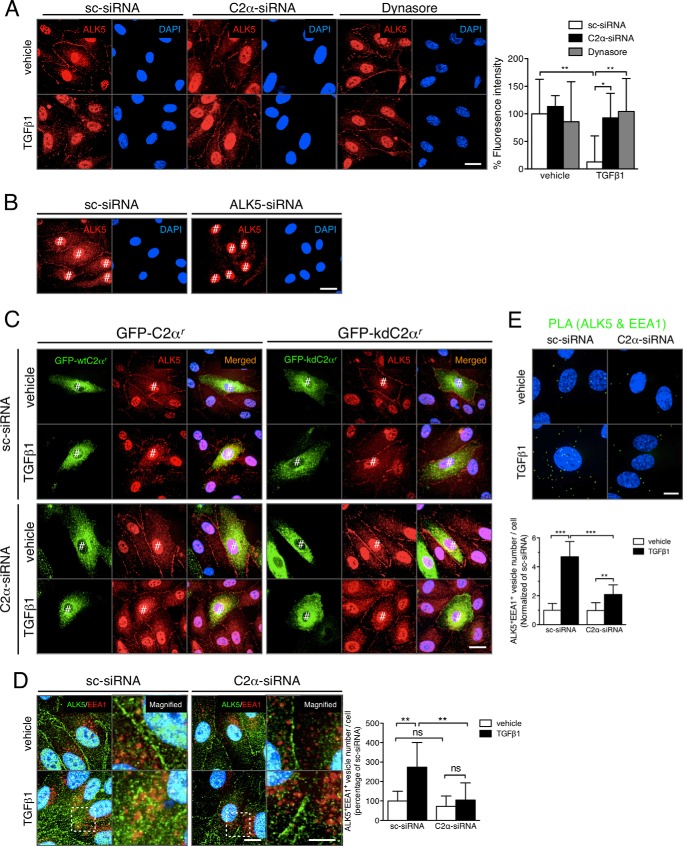
FIGURE 5.
PI3K-C2α is required for TGFβ1-induced internalization of TGFβ receptor into the early endosomes in EC. A, effects of C2α depletion or dynasore on TGFβ1-induced internalization of endogenous ALK5. The cells were either transfected with C2α#1 siRNA or sc-siRNA or pretreated with dynasore (80 μm) for 30 min and stimulated with TGFβ1 (5 ng/ml) for 30 min. Left panel, representative confocal images of the stained cells. Right panel, quantified data of fluorescence intensity per cell that were obtained from 24 cells per group. Nuclei were stained by DAPI. Scale bar, 20 μm. B, effects of ALK5 knockdown on the nuclear staining in anti-ALK5 immunostaining. HUVECs were transfected with ALK5-specific siRNA (ALK5-siRNA) or sc-siRNA, followed by anti-ALK5 immunofluorescent staining. Nuclei were stained by DAPI. Scale bar, 20 μm. #, nonspecific nuclear signals. C, effects of the expression of a kinase-deficient C2α mutant on TGFβ1-induced ALK5 internalization. HUVECs were transfected with either GFP-C2αr or GFP-kdC2αr and either C2α#1 siRNA or sc-siRNA. The cells were stimulated with TGFβ1 (5 ng/ml) for 30 min, followed by immunofluorescent staining with anti-ALK5 antibody. Nuclei were stained by DAPI. #, transfected cells. D, double immunofluorescent staining of ALK5 (green) and EEA1 (red) in TGFβ1-stimulated HUVECs. The cells were transfected with C2α#1 siRNA or sc-siRNA and stimulated with TGFβ1 (5 ng/ml) for 30 min. Left panel, representative confocal images of the stained cells. Magnified views of the boxed areas are also shown. Nuclei were stained by DAPI. Scale bar, 20 μm. Right panel, quantified data of the ALK5/EEA1-double positive vesicle numbers per cell that were obtained from 24 cells per group. E, PLA staining of ALK5 and EEA1 (green) in TGFβ1-stimulated HUVECs. The cells were transfected with C2α#1 siRNA or sc-siRNA and stimulated with TGFβ1 (5 ng/ml) for 30 min. Nuclei were stained by DAPI. Upper panel, representative confocal images of the stained cells. Scale bar, 20 μm. Lower panel, quantified data of the numbers of ALK5/EEA1 interactions per cell that were obtained from 24 cells per group.

