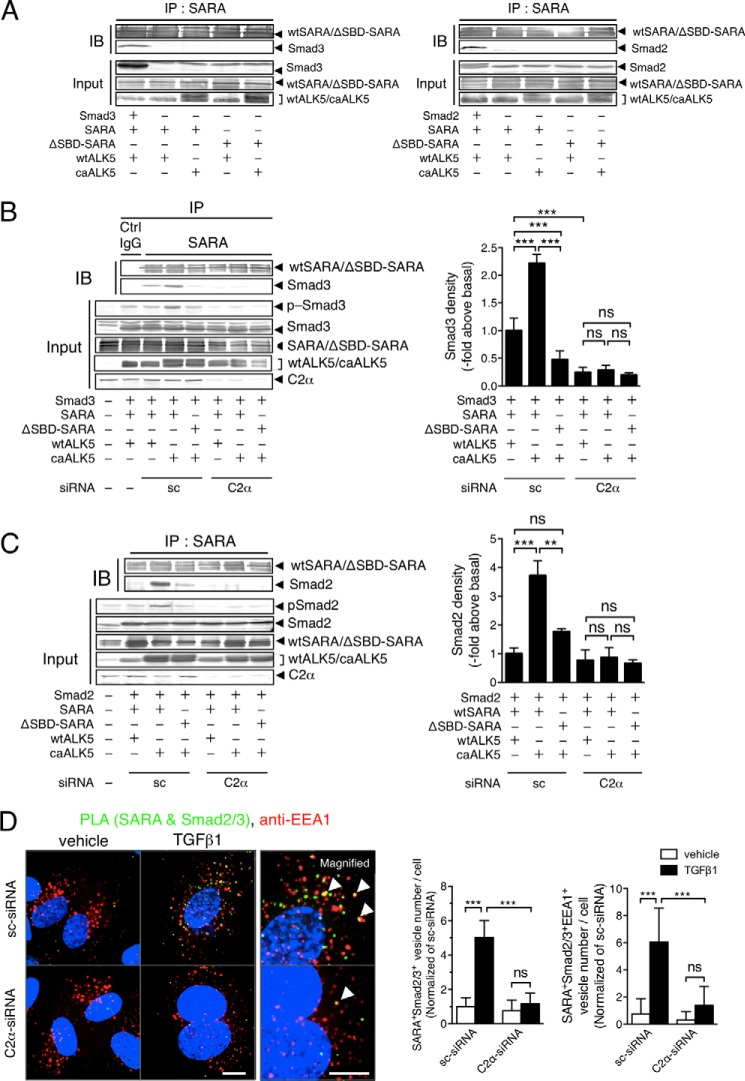
FIGURE 8.
SARA-Smad3 complex formation is dependent on PI3K-C2α. A–C, analyses of complex formation between SARA and Smad2/3 by co-immunoprecipitation-immunoblotting in HEK293T cells. A, the cells were transfected with the expression vectors for either wtSARA or ΔSBD-SARA and either wtALK5 or caALK5, with or without Smad2/3 expression vectors. The cell lysates were immunoprecipitated with anti-SARA antibody, followed by immunoblotting (IB) using anti-SARA, anti-Smad3, or anti-Smad2 antibody. B and C, the cells were co-transfected with the expression vectors for either Smad2 or Smad3, either wtSARA or ΔSBD-SARA, either wtALK5 or caALK5, and either C2α#1 siRNA or sc-siRNA. The cell lysates were immunoprecipitated with anti-SARA antibody, followed by immunoblotting using anti-SARA, anti-Smad3 antibody in B, and anti-Smad2 antibody in C. Portions of the cell lysates were analyzed for the expression of the indicated proteins with immunoblotting (Input). IP, immunoprecipitation; Ctrl, control. Left panel, representative blots. Right panel, quantified data of the amounts of Smad3 and Smad2 in immunoprecipitates from the cells transfected as indicated. The data are means ± S.E. from four independent experiments, which yielded comparable results, and expressed as multiples over the values in wtALK5- and sc-siRNA-transfected cells. D, PLA staining of SARA and Smad2/3 (green) and anti-EEA1 immunostaining (red) in TGFβ1-stimulated HUVECs. The cells were transfected with C2α#1 siRNA or sc-siRNA and stimulated with TGFβ1 (5 ng/ml) for 30 min. Left panel, representative confocal images of the stained cells. Green and red denote PLA signals and immunostaining signals, respectively. Nuclei were stained by DAPI. Scale bar, 20 μm. Right panel, quantified data of the numbers of PLA signals (left graph) and PLA signal/anti-EEA1 staining-double positive vesicle numbers per cell (right graph) that were obtained from 24 cells per group.

