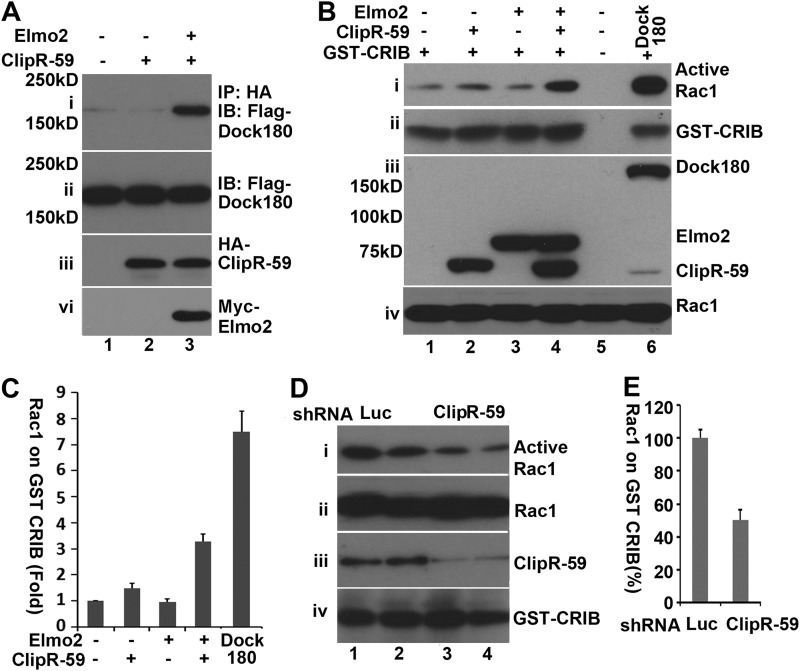
FIGURE 4.
The interaction between ClipR-59 and Elmo2 induces Rac1 activation. A, co-immunoprecipitation (IP) assay to show that Dock180 is present in the Elmo2·ClipR-59 complex. Total cell lysates from COS-7 cells that were transiently co-transfected with FLAG-Dock1 and HA-ClipR-59 or HA-ClipR59 plus Myc-Elmo2 expression vectors as indicated were subjected to immunoprecipitation with anti-HA antibody. The anti-HA immunoprecipitates were analyzed in a Western blot with HRP-conjugated anti-FLAG (i) or anti-HA-antibodies (iii), respectively. Panels ii and iv represent the cellular levels of FLAG-Dock180 and Myc-Elmo2. B, GST pulldown assay to show that interaction between ClipR-59 and Elmo2 increases the level of active Rac1. The total cell lysates from COS-7 cells that were cotransfected with FLAG-Rac1 and FLAG-ClipR-59, or FLAG-Elmo2 or FLAG-ClipR-59 plus FLAG-Elmo2 were subjected to a GST pulldown assay with recombinant GST-CRIB. The levels of Rac1 associated with GST-CRIB beads were analyzed by Western blot with anti-FLAG antibody (i). Meanwhile, total cellular levels of FLAG-Rac1, FLAG-Elmo2, and FLAG·ClipR-59 were also examined in Western blots with anti-FLAG antibody. The lane that expressed FLAG-Dock1 served as a control in this experiment. C, densitometry of the gel in B, the levels of Rac1 associated with GST-CRIB. The level of Rac1 associated with GST-CRIB in control cells was set as 1. The bar graphs show ±S.D. (n = 3). D, GST pulldown assay to show that ClipR-59 knockdown in C2C12 cells suppressed Rac activation. Total cell lysates from C2C12 cells that were transduced with either luciferase shRNA or expression lentivirus or different doses of ClipR-59 shRNA expressing lentiviruses. The levels of Rac1 associated with GST-CRIB were analyzed in Western blot with anti-Rac1 antibody. Total cellular levels of Rac1, ClipR-59, and β-tubulin were also examined in Western blots with anti-Rac1 (ii) anti-ClipR-59 (iii), and anti-β-tubulin (iv), respectively. E, densitometry of the gel in D, the levels of Rac1 associated with GST-CRIB. The level of Rac1 associated with GST-CRIB in control cells was set as 100%. The bar graphs show ± S.D. (n = 4). IB, immunoblot.

