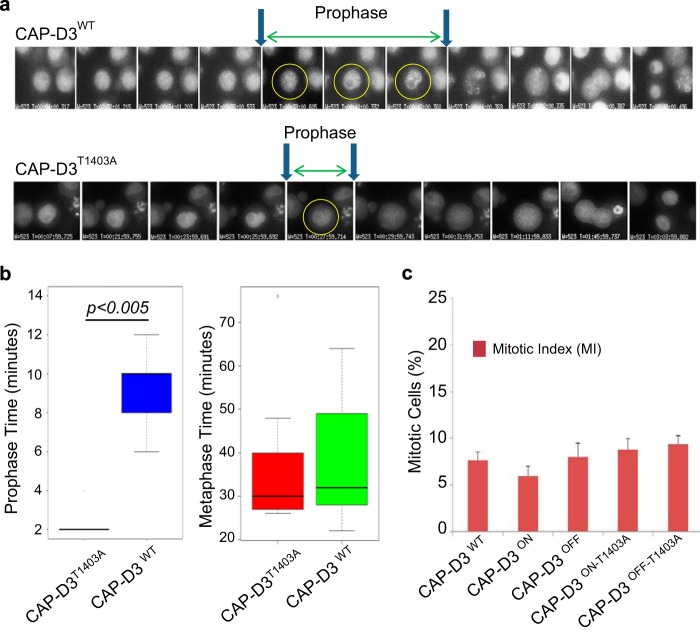
FIGURE 4.
Live cell imaging and analysis of CAP-D3WT and CAP-D3T1403A. A, examples of CAP-D3WT and CAP-D3T1403A live cell imaging analysis during mitosis. Images were taken every 2 min up to prophase. After prophase, selective images are shown for metaphase, anaphase, telophase, and cytokinesis from the same movies. Note that CAP-D3T1403A cells segregate chromosomes normally. B, quantitation of time in prophase and time from NEBD to anaphase for CAP-D3WT and CAP-D3T1403A. Note the very short prophase of mutant relative to wild type. There is no statistical significance between CAP-D3WT and CAP-D3T1403A for the metaphase to anaphase transition. C, the mitotic index for CAP-D3WT, CAP-D3T1403A, and CAP-D3 KO cells. This was calculated as the percentage of phospho-H3 positive cells from total cells. Our calculation of mitotic index includes anaphase and telophase cells. Five independent CAP-D3T1403A clones were used for the scoring.

