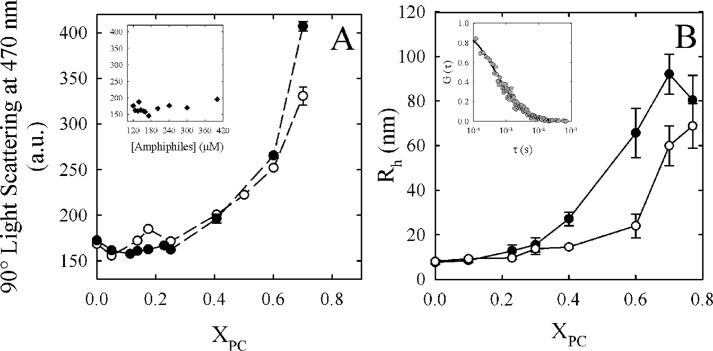
FIGURE 3.
Micelle-vesicle transition of C12E10/DLPC and C12E10/DMPC mixtures. A, 90° light scattering (470 nm) expressed in arbitrary units (a.u.) as a function of XPC for C12E10/DLPC (white circles) and C12E10/DMPC (black circles) mixtures in the same conditions in which the Ca2+-ATPase activity was determined in Fig. 1A. No enzyme was added in the mixture. Inset, 90° light scattering (470 nm) as a function of C12E10 concentration (in the absence of DMPC or DLPC). B, hydrodynamic radius (RH) of the micelles/vesicles as a function of XDLPC (white circles) and XDMPC (black circles), in the same conditions in which the Ca2+-ATPase activity was determined in Fig. 1A. No enzyme was added in the mixture. Inset, normalized experimental autocorrelation curve obtained at XDMPC = 0.25. By fitting a three-dimensional diffusion model (Equation 2) to these experimental data, we obtained a characteristic residence time (τD) of the particles diffusing through the observation volume. The residence time can be related to the diffusion coefficient D (Equation 3) and finally with the RH (Equation 4) of the fluorescent particles. The values shown are the mean ± S.E. (error bars) of at least three independent experiments performed in triplicate.

