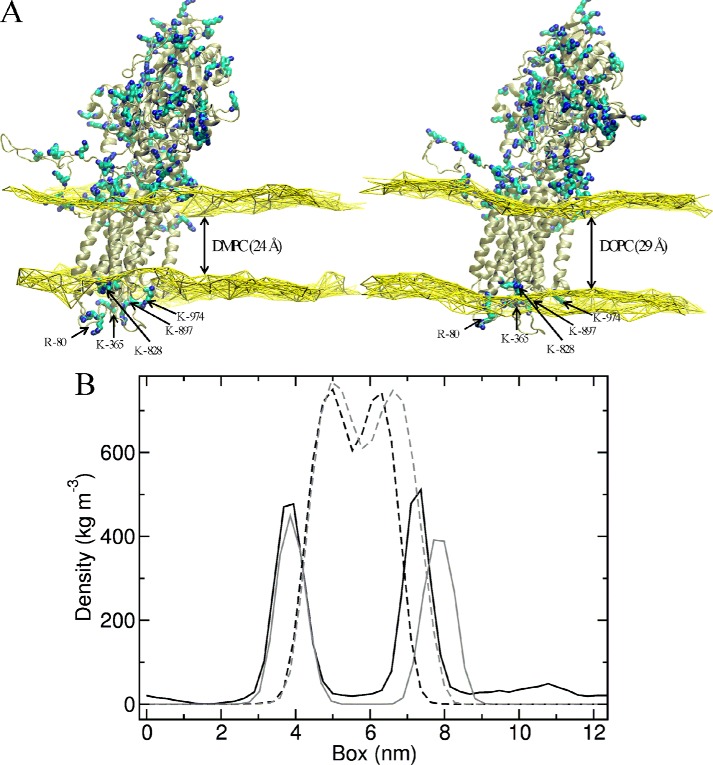
FIGURE 7.
MD simulations of PMCA model in DMPC and DOPC bilayers. A, average of PMCA model structure together with a yellow surface representing the average positions of phosphorus atoms in DMPC (left) or DOPC (right) bilayer. Lysine (K) and arginine (R) residues are shown as cyan and blue sticks. The arrows show Arg-80, Lys-365, Lys-828, Lys-897, and Lys-974 residues, located in the PMCA extracellular domain. B, density graph of the polar heads and hydrophobic tails. The polar heads of DMPC (gray) and DOPC (black) are shown in continuous lines, and the hydrophobic tails are shown in dotted lines.

