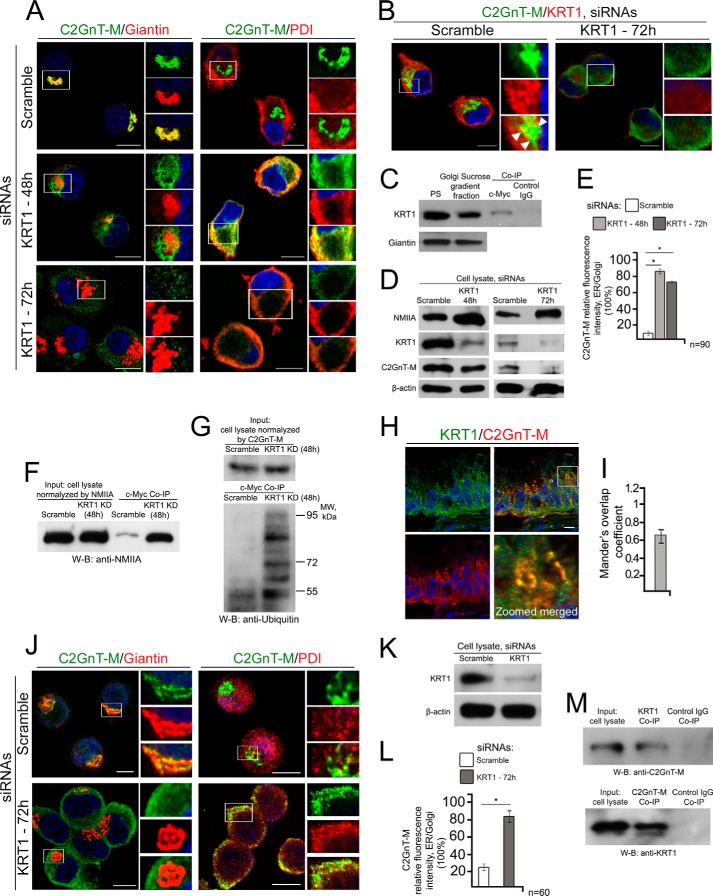
FIGURE 2.
Knockdown of KRT1 resulted in NMIIA-mediated ER redistribution of C2GnT-M in Panc1-bC2GnT-M-c-Myc cells. A, confocal immunofluorescence images of C2GnT-M and Giantin and of C2GnT-M and PDI in cells treated with scramble siRNAs or KRT1 siRNAs for 48 h and 72 h. B, confocal immunofluorescence images of C2GnT-M and KRT1 in cells treated with scramble or KRT1 siRNAs for 72 h. White boxes in each panel are enlarged and shown at the right side as green, red, and merged images. Nuclei were counterstained with DAPI (blue). All confocal images were acquired with same imaging parameters; bars, 10 μm. C, C2GnT-M and KRT1 were associated with the Golgi. Golgi membranes were isolated from control cells as described under “Experimental Procedures,” and 30 μg of total protein of Golgi or postnuclear supernatant (PS) was immunoblotted for Giantin and KRT1. The Golgi fraction was subjected to co-IP with c-Myc Ab. D, NMIIA, KRT1, and c-Myc Western blots of the lysates of cells treated with scramble or KRT1 siRNAs for 48 h and 72 h; β-actin was a loading control. E, quantification of relative fluorescence intensity (in a.u.) of C2GnT-M in ER versus Golgi in cells presented in A; *, p < 0.001. F and G, NMIIA and ubiquitin Western blot (W-B) of complexes pulled down with anti-c-Myc Ab from the lysate of cells treated with scramble or KRT1 siRNAs for 48 h. Lysates containing equal amounts of NMIIA (F) or C2GnT-M (G), respectively, were used for co-IP. H, KRT1 and C2GnT-M distribution in the goblet cells of human normal colon tissues. The paraffin sections were immunofluorescently stained for KRT1 (green) and C2GnT-M (red) and then analyzed by confocal fluorescence microscopy. White boxes indicate an area enlarged in the bottom panel that represents merged channels; bar, 10 μm. I, quantification of Mander's coefficient of KRT1 and C2GnT-M colocalization of cells presented in H. J, colocalization of C2GnT-M with Giantin and PDI in the primary human colonic epithelial cells. White boxes in each panel are enlarged and shown at the right side as green, red, and merged images. Nuclei were counterstained with DAPI (blue). All confocal images were acquired with same imaging parameters; bars, 10 μm. K, KRT1 Western blot of the lysate of primary human colonic epithelial cells treated with scramble or KRT1 siRNAs for 72 h; β-actin was a loading control. L, quantification of relative fluorescence intensity (in a.u.) of C2GnT-M in ER versus Golgi in cells presented in J; *, p < 0.001. M, the complexes pulled down with anti-KRT1 and anti-C2GnT-M Abs from the lysate of primary human colonic epithelial cells were blotted with anti-C2GnT-M and anti-KRT1 Abs, respectively. Cell lysate exposed to nonspecific IgG served as the negative control.

