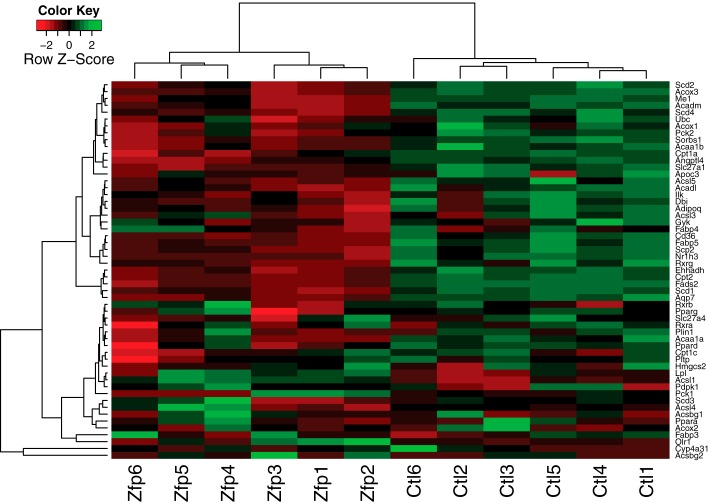
FIGURE 7.
ZFP407 deficiency reduces expression of PPAR target genes. Heat map of the RNA-Seq expression profiles of PPAR target genes (KEGG pathway mmu03320). Red indicates decreased relative expression, green indicates increased relative expression. Only genes expressed in all samples (FPKM > 0) are shown. Zfp1–6 represents 6 independent electroporations of differentiated 3T3-L1 adipocytes with Zfp407 siRNA#1 (Zfp1–3) or Zfp407 siRNA#2 (Zfp4–6). Ctl 1–6 represents 6 independent electroporations of differentiated 3T3-L1 adipocytes with the control siRNA.

