FIGURE 1.
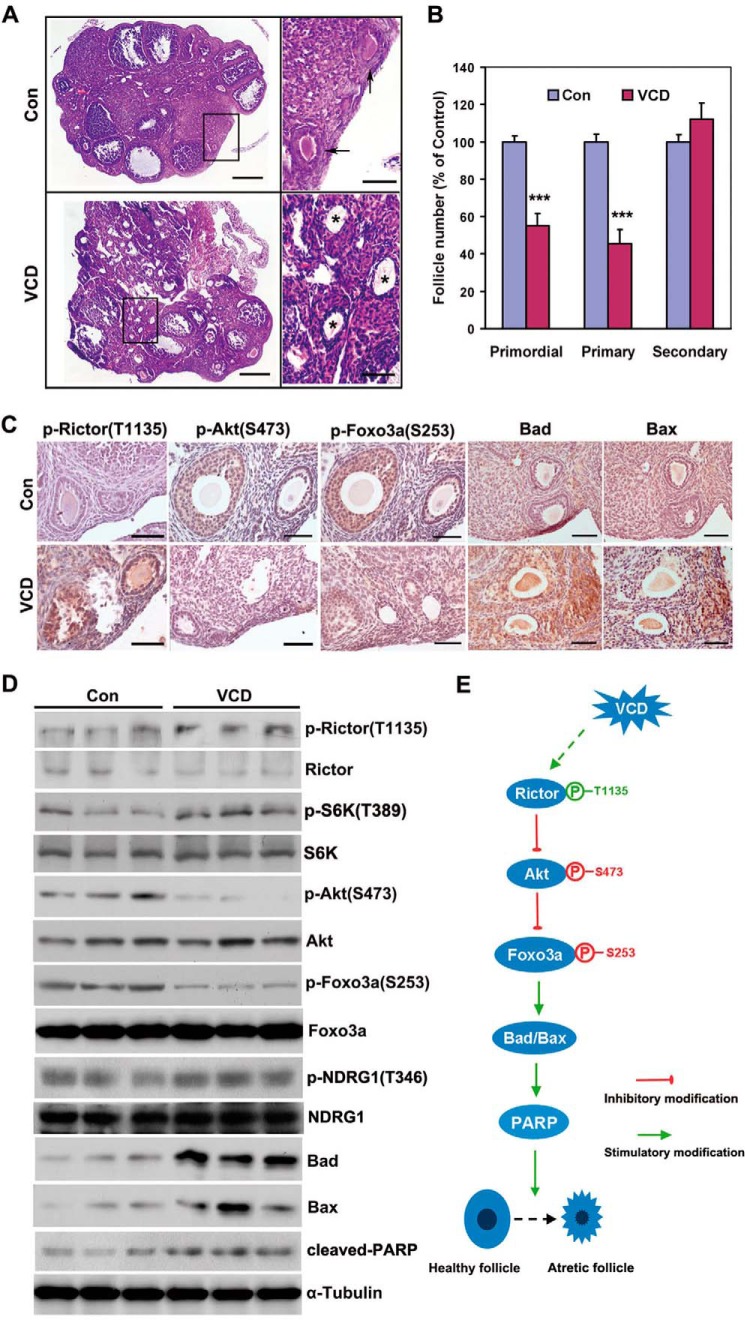
4-VCD destroys small follicles and inhibits Rictor/mTORC2 signaling. A, representative H&E images of ovaries from 4-week-old mice treated with VCD or vehicle (Con) for 15 days, respectively. Arrows indicate primordial or primary follicles in the control group, whereas massive atretic (apoptotic) follicles were observed in the VCD group (asterisk). Scale bar = 500 μm for the left panel, 50 μm for the right panel. B, the percentage of primordial and primary follicles in the control and VCD groups. Follicles at each stage were classified, counted, and calculated in proportion to the total number of follicles in each group. Bars indicate mean ± S.E. ***, p < 0.001. C, immunohistochemical analysis showed changes in Rictor/mTORC2 signaling after VCD treatment. Scale bar = 50 μm. D, Western blot analysis of Rictor/mTORC2 signal activity before and after VCD treatment. Protein samples were extracted from the whole ovary. Three individual mice of each group are shown. NDRG1, N-Myc downstream-regulated 1. E, schematic of the mechanism underlying VCD-induced ovarian toxicity in which Rictor plays a central role.

