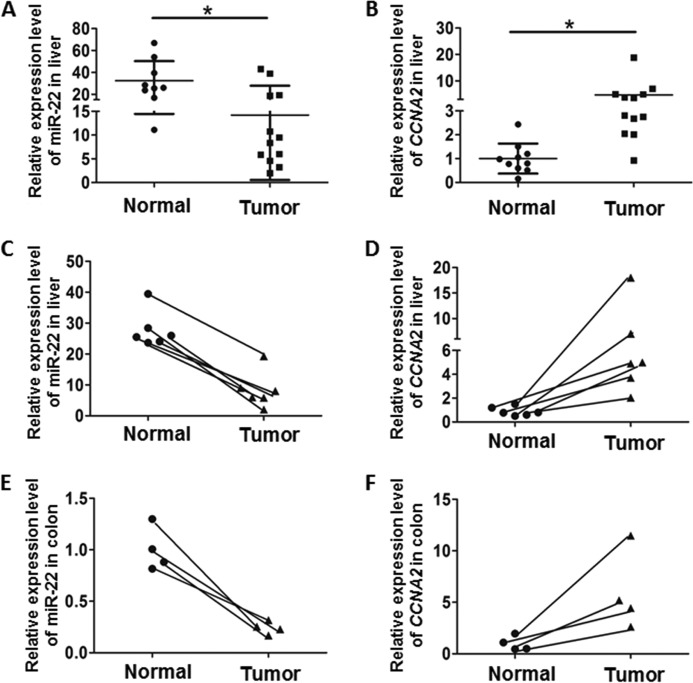
FIGURE 6.
Correlation between miR-22 and CCNA2 expression level in liver and colon cancer specimens. A and B, relative expression of miR-22 (A) and CCNA2 (B) was quantified in HCC compared with normal livers. C and D, relative expression of miR-22 (C) and CCNA2 (D) in liver was quantified. Among the studied liver specimens, six pairs were derived from tumors and adjacent healthy tissues of the same individuals. E and F, expression of miR-22 (E) and CCNA2 (F) was also studied in four paired colon cancer tissues and normal adjacent specimens. *, p < 0.05.

