FIGURE 3.
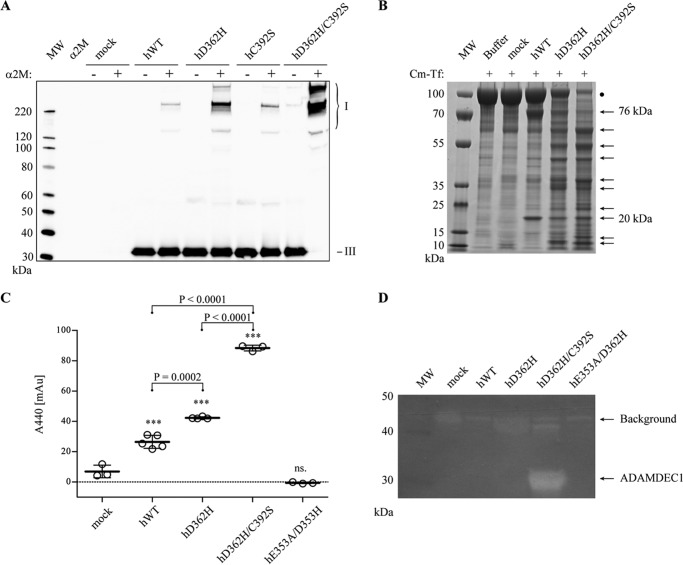
Influence of the C392S substitution on hADAMDEC1 D362H. A, α2M-cross-linking assay with hADAMDEC1 variants visualized by anti-hADAMDEC1 Western blot analysis. The different α2M·ADAMDEC1 complexes (I) are observed at the top of the blots, whereas the added protease (III) is seen at the bottom. B, digestion of Cm-Tf (marked by a black dot) by a 500 nm concentration of the indicated hADAMDEC1 variants analyzed by reducing SDS-PAGE. C, proteolytic activity against soluble, azo-labeled casein. The sample means are shown by thick horizontal lines. For one-way analysis of variance: ***, p < 0.0001; ns, not significant relative to mock. Student's t tests comparing individual sets of data are shown with a horizontal bracket. D, casein zymogram of hADAMDEC1 variants. Caseinolytic activity is observed by the appearance of white bands (indicated by arrows). A distinct band of ∼32 kDa, consistent with the molecular mass of hADAMDEC1 D362H/C392S, is observed.

