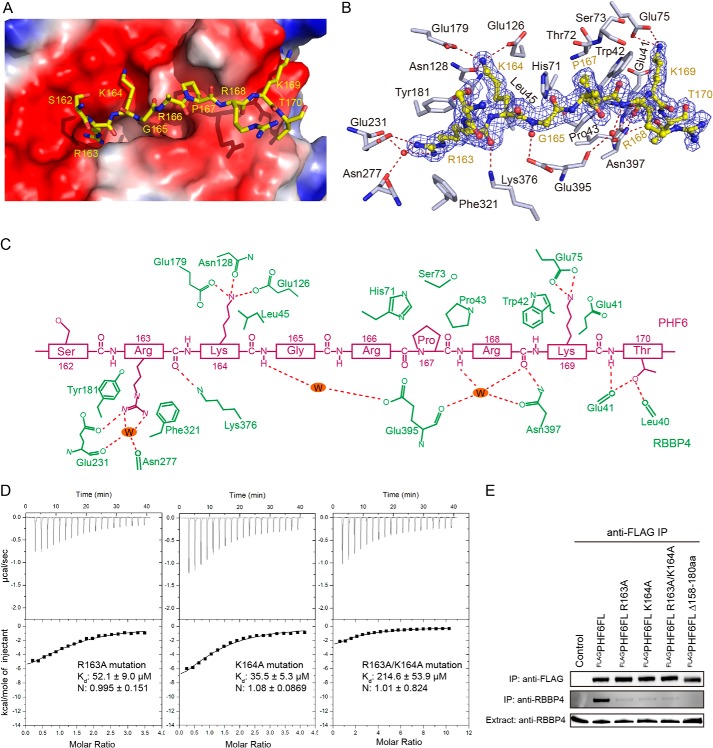
FIGURE 3.
Recognition of the PHF6 peptide by RBBP4. A, electrostatic surface potential representation of the binding pocket with the PHF6 peptide (shown in yellow stick model). B, a simulated annealing omit map (blue) contoured at 1.0σ shows the electron density for the PHF6 peptide bound to RBBP4. RBBP4 residues are shown in gray, and water molecules are shown as red dots. C, schematic representation of the interactions observed between RBBP4 and the PHF6 peptide. Residues in RBBP4 (green labels) that engage in van der Waals contacts and hydrogen bonds or salt bridge interactions with the PHF6 peptide (purple labels) are shown. Hydrogen bonds and salt bridge interactions are delineated by red dashed lines. D, ITC assays for determining the interaction between RBBP4 and PHF6 peptide mutants. E, co-immunoprecipitation (IP) assays with PHF6 and RBBP4. FL, full-length; aa, amino acids.

