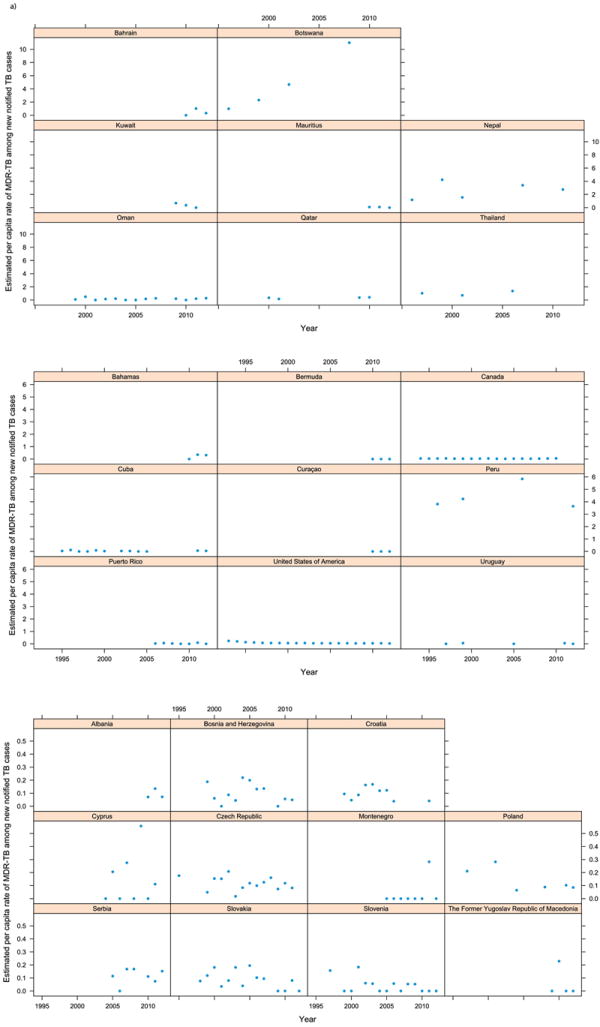
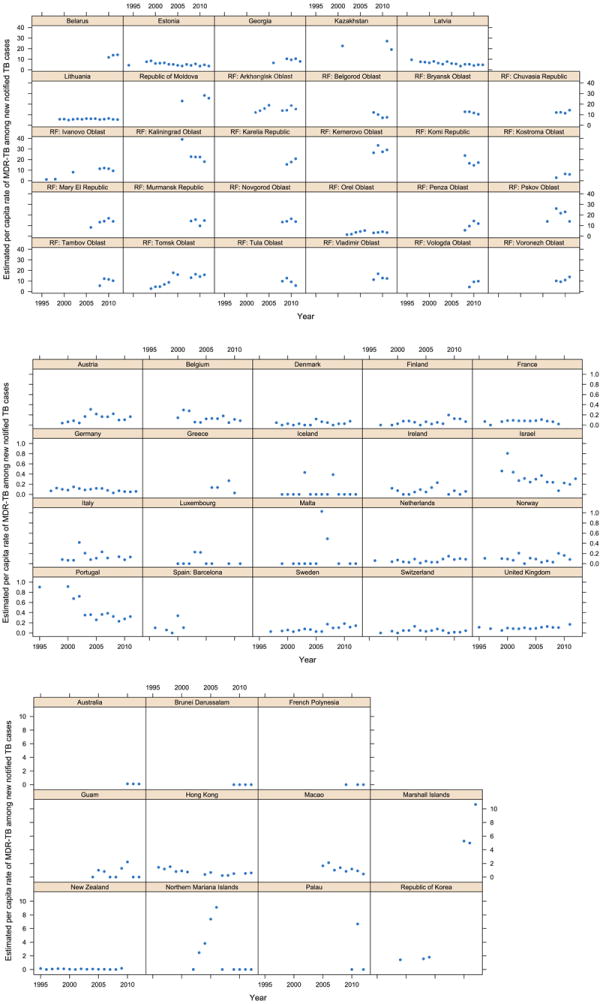
Appendix Figure 1. Time series of estimated per capita rates of MDR-TB among notified new TB cases for each country with at least 3 data points.


Sequential panels depict the rates by WHO region (or sub-region): a) Africa, Eastern Mediterranean, and South East Asia; b) Americas; c) Europe, Central; d) Europe, Eastern; e) Europe, Western; f) Western Pacific.
