
Fig. 2.
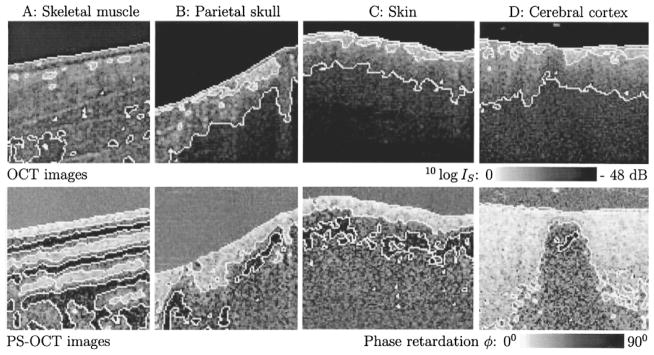
Upper panel shows OCT images. White lines are contours at −16 dB (white to gray transition) and −32 dB (gray to black transition) intensity levels, respectively. Lower panel shows PS-OCT images. White lines are contours at 30° (white to gray transition) and 60° (gray to black transition) phase retardation levels, respectively. The phase retardation above the sample surfaces was ≈45°, determined by an approximately equal noise level in each polarization channel. A: 1 mm × 1 mm image of ex vivo rat skeletal muscle. Three periods of the phase retardation can be observed in the PS-OCT image; such detail is not discernible in the OCT image. B: 1 mm × 1 mm image of ex vivo rat parietal skull. C: 1.2 mm × 1 mm image of ex vivo rat skin. PS-OCT images B and C show dark islands below the surface confined by the 60° phase contour line. D: 1.2 mm × 1 mm image of dissected ex vivo rat cerebral cortex. The birefringent region in the PS-OCT image is a strip of white matter, surrounded by gray matter.