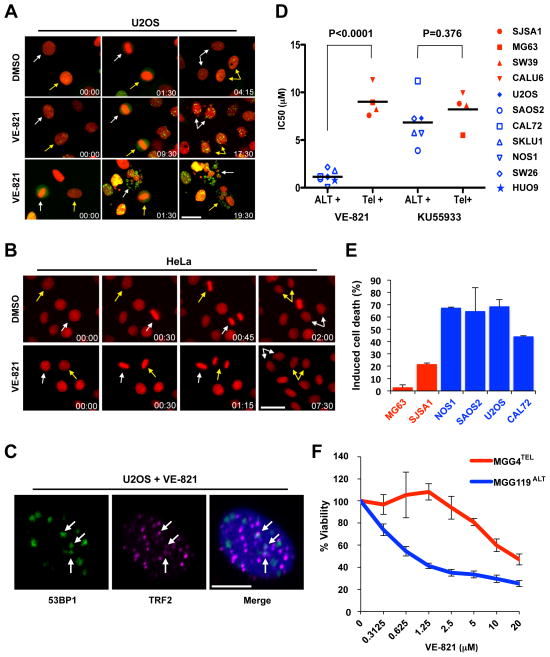
Figure 4. Selective killing of ALT cells by ATR inhibitor.
(A–B) Stills from time-lapse live-cell imaging experiments of (A) U2OS cells stably expressing H2B-mRFP and 53BP1-GFP or (B) HeLa cells expressing H2B-mRFP following treatment with either 5 μM VE-821 or vehicle control (DMSO). Colored arrows mark individual cells as they progress through mitosis. Time scale: hr:min. Scale bar: 30 μm. At least 150 cells were scored for each condition over two independent experiments. (C) U2OS cells were treated with VE-821 as in (A), and analyzed by immunofluorescence using 53BP1 and TRF2 antibodies. Scale bar: 10 μm. (D) A panel of osteosarcoma cell lines were mock treated, treated with VE-821, or KU-55933 for 4–6 days. Cell viability was determined using CellTiter Glo. Dots represent IC50s calculated from experiments preformed in triplicate (n=3). (E) The osteosarcoma cell lines were treated with 3 μM VE-821 for 6 days, and cell death was quantified by Annexin V staining. Induced cell death is graphed as the mean with error bars representing standard deviation (n=2). (E) MGG4TEL and MGG119ALT cells were treated with increasing concentrations of VE-821 for 6 days. Cell viability was determined using CellTiter Glo. Error bars represent standard deviation, experiment performed in duplicate (n=2).

